
Research - (2023) Volume 13, Issue 6
Adaptability evaluation of castor bean (Ricinus communis L.) genotypes at wondogenet, Ethiopia
K.W. Hussen*Abstract
Castor (Ricinus communis L.) locally known as ‘Gulo’ is a species of flowering plants in the spurge family (Euphorbiaceae) which contains a vast number of plants mostly native to the tropics. Castor belongs to a monotypic genus Ricinus and sub-tribe Ricininae. It was initially believed to have four centers of origin: East Africa (Ethiopia), Northwest and South West Asia and Arabian Peninsula, India, and China. However, Ethiopia is considered to be the most probable site of origin because of the presence of high diversity. The overall objective of this research was conducted to test environmental adaptability of castor bean genotypes at wondogenet, Ethiopia. The experiment was conducted at Wondogenet Agricultural Research Center’s (WGARC) on-station testing site during the main cropping season of 2022. Highly significant (P<0.01) differences among varieties were observed in the testing site for days to plant height, number of capsules per plant, number of nods per plant, nod length, number of branches per plant and seed yield per hectare. Caster seed yield for genotypes tested at the tested area ranged from 1114 to 1451.27 kg/ha, and the mean value was 1235.95 kg/ha. The top yielders included Acc#95, Acc#82, and Hiruy, with 1451.27, 1294.03, and 1260.27 kg/ha, respectively. Compared with environmental variance, genetic variance was larger for plant height, number of racem per plants, length of main racem, number of capsuls per plant, number of nodes per plants, node length and number of branches per plants. Therefore, the higher proportion of phenotypic variance observed on these traits was due to the larger proportion of genotypic variance.
Keywords
Adaptability, Heritability, Environment genotype, Phenotype castor.
Introduction
Castor (Ricinus communis L.) locally known as ‘Gulo’ is a species of flowering plants in the spurge family (Euphorbiaceae) which contains a vast number of plants mostly native to the tropics. Castor belongs to a monotypic genus Ricinus and sub-tribe Ricininae. It was initially believed to have four centers of origin: East Africa (Ethiopia), Northwest and South West Asia and Arabian Peninsula, India, and China. However, Ethiopia is considered to be the most probable site of origin because of the presence of high diversity (Anjani, 2012). In Ethiopia, Castor grows as annual in the low lands to small tree perennial in the high lands. India, china, Brazil and USA are the major castor producers globally. Castor varies greatly in its growth and appearance. It varies in growth habit, color of foliage, stems, seed size, seed color and oil content; so that varieties often bear little resemblance to one another. Some are large perennials often developing into small trees, others behave as short-lived dwarf annuals and every gradation between the extremes can be found. The stem is round and glabrous, sometimes covered with a waxy bloom which gives red or green stems a bluish appearance on the field. The leaves are large, often dark glossy green about 15 to 45 centimeters long, with long petioles. The flowers are borne on inflorescence which forms a pyramidal raceme known as spikes or candle. The racemes are borne terminally on main and lateral branches. The fruit is usually a schizocarp; a spiny capsular fruit with three cells each of which splits open at maturity into separate parts and then breaks away explosively, scattering the seeds.
Castor grows throughout the warm-temperate and tropical regions, and flourishes under varieties of climate conditions that its range cannot easily be defined. Castor is naturally a long-day plant, but it is adaptable with fewer yields to a wide range of photoperiods (Weiss, 1983). It grows well on rich soil and tolerates not less than daytime temperatures of 20oC throughout the growing period (Gana, et al., 2013). Average daily temperature of 28°C is optimum for the production of seeds with high oil content. Low temperatures prolong the time of seedling emergence thereby exposing seeds to fungi attack. High temperatures of about 40oC during flowering adversely affect the seed setting.
Cultivated castor requires fertile, well aerated soils with a pH of 4.5-8.3 and rainfall of 200-4290 mm for optimum yield (Gana, et al., 2013). Excessive precipitation encourages prolific vegetative growth at the expense of flower and seed setting. High humidity associated with high rainfall may impair pollination as it reduces the viability of the grain. Capsules and foliage diseases become rampant with increase in humidity.
Castor is widely accepted as an agricultural solution for all tropical and subtropical regions, addressing the need for commercial crops with low imputes costs and viable returns (Gana, et al., 2013). Castor is seen as an ideal candidate for agricultural revenue-generating produce which has the potential to become the premier vegetable oil for industries across the globe. The high potential yield and unique fatty acid composition allow castor oil to produce economically competitive feedstock needed for production of premium quality biodiesel, short chain aviation fuels, derived fuel lubrication additives and very high value biopolymers. Castor oil is considered superior to petrochemical ones due to its physical properties and eco-friendly source. Since castor is not used as food and can be grown productively on marginal lands, it presents a unique opportunity to expand industrial vegetable oil production in Africa. Castor provides opportunities in all aspects of agribusiness ranging from crop production, seed supply, agrichemicals, breeding, farm machinery, distribution, processing, marketing and retail sales.
There are various challenges that make castor crop cultivation difficult. Climatic and environmental adaptability is one of the challenges restricting castor plantation. The plant also contains a toxic protein known as ricin, providing a challenge from being produced. It also requires a labor-intensive harvesting process in Ethiopia and other developing countries to pursue castor plantation. Therefore, this research was conducted to test environmental adaptability of castor bean genotypes at wondogenet, Ethiopia.
Materials and Methods
Description of the study area
The experiment was conducted at Wondogenet Agricultural Research Center’s (WGARC) on-station testing site during the main cropping season of 2022. Wondogenet Agricultural Research Center has a unimodal rainfall pattern, which starts at June and extends to mid-October. the maximum rainfall is received during June to September. The major soil type is Sandy soil with a dark brown color. It is 7°19’N and 38°38’E with an altitude of 1780 meters above sea level.
Experimental materials
In this experimental study, a total of 6 pipe line castor genotypes were used (Table 1).
| Item number | Name of Genotypes |
|---|---|
| 1 | Hiruy |
| 2 | Acc#81 |
| 3 | Abaro |
| 4 | Acc#80 |
| 5 | Acc#95 |
| 6 | Acc#82 |
Table 1. List of 6 genotypes of castor used in the study area.
Experimental design
Six pipe line castor genotypes were organized in a randomized complete block design with three replications. five rows of 3.2 m length were used for each plot. Inter-row spacing of 1m were used thus making a plot size of 16 m2 (5 rows x 3.2 m x 1 m). The spacing between plots and blocks was 0.5 m and 1.5 m, respectively.
Management practices
All recommended agronomic practices which included land preparation to harvesting were followed as per the recommendations. Plantings were carried out in July. Recommended NPS and urea fertilizers (each at 100 kg per hectare) were applied at sowing and later after plant establishment. All NPS was applied at sowing time while urea was applied in split, 2/3 at sowing and 1/3 at initial flowering stage. To control grass and broad leaf weeds, two hand weeding were performed at critical stages of crop development.
Data collection
Yield and yield related parameters and morphological and agronomic data were collected and recorded on a plot basis from the central three rows and on a plant basis from randomly selected plants from the central three rows in each plot.
Measurement of phenological and growth parameters
Data of different traits were collected and recorded either from randomly selected plants or on a plot basis. Days to initial flowering (DIF) was recorded as the number of days from seedling emergence to the appearance of first flowers in each plot. Days to 50% flowering (D50% F) was recorded as number of days from seedling emergence to a growth stage when about 50% of plants have flowered in each plot. Days to maturity (DM) was recorded as days from seedling emergence to the appearance of open flower on about 95% of the plants in each plot. Plant height (PHt) was recorded by measuring the height of 5 randomly selected plants at maturity from ground level to the tip of the stem and taking mean of the total. Number of Racems (NR) was counted and recorded the racem of 5 reandoly selected plants at central rows. Length of main racem (LMR) was randomly measured the length of main racem of 5 the plants at central rows. Number of Capsuls (NoC) was counted and recorded the capsuls of 5 reandoly selected plants at central rows. Number of Nodes (NoN) was counted and recorded the nodes of 5 reandoly selected plants at central rows. Node length (NL) was randomly measured the length of nodes of 5 the plants at central rows. Number of branches (NoBr) was counted and recorded the branches of 5 reandoly selected plants at central rows. Hundred Seed weight in gram (SW) was counted and recorded the weight of 100 seeds in gram. Seed yield (SYLD) was measured and recorded the weight of seeds in in kg per ha.
Data analysis
Analysis of variance
The data collected were subjected to statistical analysis. The analysis was done using the SAS computer program, version 9.0 (SAS, 2002). Mean separation was conducted using Least Significance Difference (LSD) at 0.05 probability level. The simple correlation coefficients were computed to determine the degree of association between pair of characters using PROC CORR procedure of SAS (SAS, 2002) program based on across location mean data (Table 2).
| Source of Variation | Df | Mean Square | Expected Mean Square |
|---|---|---|---|
| Replication | r-1 | MSr | σ2e+gσ2r |
| Genotypes | g-1 | MSg | σ2e+rσ2g |
| Error | (r-1) (g-1) | MSe | σ2e |
Table 2. Analysis of variance in randomized complete block design and expected mean square by adapting the formula suggested by Hallauer and Miranda (1988), and Wricke and Weber (1986).
Analysis of variance in a randomized complete block design was computed using the following model:
Yij=μ+rj+gi+εij
Where,
Yij=the response of trait Y in the ith genotype and the jth replication
μ=the grand mean of trait Y;
rj=the effect of the jth replication;
gi=the effect of the ith genotype; and
εij=experimental error effect.
Phenotypic and genotypic variances
The phenotypic and genotypic variances of each trait were estimated from the RCBD analysis of variance and the expected mean squares under the assumption of random effects model computed from linear combinations of the mean squares and the phenotypic and genotypic coefficient of variations, which were also computed as per the methods suggested by Burton et al., (1953).
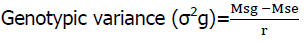
Environmental variance (σ2e)=MSe
Where,
MSg and MSe are the mean sum of squares for the genotypes and error in the analysis of variance, respectively.
r is the number of replications.
Then, the phenotypic variance was estimated as the sum of the genotypic and environmental variances:
Phenotypic variance (σ2p)=σ2g+σ2e
Genotypic and phenotypic coefficient of variations
The genotypic and phenotypic coefficients of variability were estimated according to the formulae of Singh and Chaudhary, (1977) as follows:
Genotypic Coefficient of Variation (GCV)=(σg/grand mean) × 100
Phenotypic Coefficient of Variation (PCV)=(σp/grand mean) × 100
Where, σg and σp are genotypic and phenotypic standard deviations, respectively.
Heritability analysis
Broad sense heritability values were estimated based on the formula of Falconer et al., 1996 as follows:
Heritability in broad sense (H2)=(σ2g/σ2p) × 100
Then, the genetic advance for selection intensity (k) at 5% was estimated by the following formula (Allard, 1960):
EGA=k × σp × H2
Where, EGA represents the expected genetic advance under selection;
σph is the phenotypic standard deviation;
H2 is heritability in broad sense and k is selection intensity.
The genetic advance as percent of population mean was also estimated following the procedure of Johnson et al., (1955):
Genetic advance as percent of population means=(EGA/grand mean) × 100
Results and Discussion
Analysis of variance
The analysis of variance results for the twelve traits studied are given in Table 3. Highly significant (P<0.01) differences among varieties were observed in the testing site for days to plant height, number of capsules per plant, number of nods per plant, nod length, number of branches per plant and seed yield per hectare. However, traits namely days to initial flowering, days to 50% flowering, days to maturity and hundred seed weight showed non-significant difference among the listed varieties.
| Trait | Rep (2) | Geno (5) | Error (10) | CV (%) | R2 |
|---|---|---|---|---|---|
| DIF | 18.06ns | 4.62ns | 6.18 | 3.26 | 0.49 |
| D50F | 96.22** | 5.25ns | 7.29 | 2.61 | 0.75 |
| DM | 45.39** | 4.99ns | 11.66 | 2.49 | 0.50 |
| PHt | 1107.77ns | 3868.84** | 658.97 | 9.13 | 0.77 |
| NR | 5.83ns | 13.98ns | 7.42 | 14.53 | 0.52 |
| LMR | 16.99ns | 84.84ns | 47.39 | 12.32 | 0.49 |
| Noc | 6.04ns | 237.88** | 4.09 | 4.30 | 0.97 |
| Nno | 1.61ns | 29.70** | 1.98 | 6.11 | 0.88 |
| NL | 0.61ns | 6.44** | 1.33 | 4.81 | 0.71 |
| NoBr | 0.99ns | 21.45** | 0.66 | 5.94 | 0.94 |
| SW | 19.09ns | 22.50ns | 20.58 | 10.11 | 0.42 |
| SYLD | 15645.66ns | 48397.38** | 7136.24 | 6.83 | 0.79 |
Table 3. The analysis of variance results of the twelve (12) traits of Castor genotypes at Wondo genet.
Yield and yield components of genotypes
Seed yield (SYLD) for genotypes tested at the tested area ranged from 1114 to 1451.27 kg/ha, and the mean value was 1235.95 kg/ha (Table 4).
| G/types | DIF | D50F | DM | PHt | NoR | LMR | NoC | Nno | NL | NoBr | SW | SYLD | OC |
|---|---|---|---|---|---|---|---|---|---|---|---|---|---|
| Hiruy | 74.67a | 102.67a | 136.33a | 343.6a | 18.6ba | 56.4ba | 43.47c | 25b | 24bc | 17.67a | 41.55a | 1260.27cb | 39.20 |
| Acc#81 | 75.67a | 103.67a | 135a | 298.67ba | 17.2ba | 60.13a | 41.47dc | 21.53cd | 26.33a | 10.8d | 42.37a | 1150.88cb | 40.20 |
| Abaro | 76.33a | 103.33a | 137.33a | 257.33bc | 21.13a | 55.33ba | 39.6d | 21.4cd | 23.6b | 14.87b | 43.82a | 1114c | 39.60 |
| Acc#80 | 76.67a | 104.33a | 138.33a | 254.67bc | 18.73ba | 46.13b | 40.93dc | 19.4d | 21.93c | 14.93b | 46.56a | 1145.23cb | 40.60 |
| Acc#95 | 75.67a | 101a | 135.33a | 282.67bc | 21.13a | 56.27ba | 63.13a | 22.67cb | 24.8ba | 13.13c | 48.617a | 1451.27a | 40.00 |
| Acc#82 | 78.33a | 104.67a | 137.33a | 250c | 15.67b | 61.13a | 49.13b | 28.27a | 23.53bc | 10.8d | 46.37a | 1294.03b | 41.20 |
| Mean | 76.22 | 103.28 | 136.61 | 281.16 | 18.74 | 55.9 | 46.29 | 23.04 | 24.03 | 13.7 | 44.88 | 1235.95 | 40.1 |
| LSD | 4.52 | 4.91 | 6.21 | 46.7 | 4.95 | 12.52 | 3.68 | 2.56 | 2.1 | 1.48 | 8.25 | 153.68 | |
| CV | 3.26 | 2.61 | 2.49 | 9.13 | 14.53 | 12.32 | 4.3 | 6.11 | 4.81 | 5.94 | 10.11 | 6.83 |
Table 4. Mean values of 12 traits of 6 Castor genotypes at Wondo genet.
The top yielders included Acc#95, Acc#82, and Hiruy, with 1451.27, 1294.03, and 1260.27 kg/ha, respectively. All of the above genotypes, except Abaro, showed satisfactory seed yield potential. Intermediate yielders were Acc# 81 and Acc# 81, all with seed yield of slightly lower than the mean value of 1235.95 kg/ha.
The shorter the number of days taken to produce initial flowering, the earlier is the seed setting and hence the earlier the variety.
A Variety called Hiruy recorded minimum of 74.5 days to initial flowering, followed by genotypes called acc#81 and acc#95 with 75.67 days; whereas A genotype called ACC.#82 was exhibited maximum of 78.33 days to initial flowering. This showed that delay in flowering is the sign of late maturity.
Variance components and coefficients of variation
Estimates of phenotypic (s2p), genotypic (s2g) and environmental (s2e) variances and phenotypic (PCV) and genotypic coefficients of variation (GCV) are given in Table 5 below for testing site.
Estimates of genetic variance ranged from 1.1 for number of days to maturity to 3649.17 for plant height. The range of phenotypic variance was ranged 7.32 for node length to 9596.87 for Seed yield in kg per ha (Table 5). Compared with environmental variance, genetic variance was larger for plant height, number of racem per plants, length of main racem, number of capsuls per plant, number of nodes per plants, node length and number of branches per plants. Therefore, the higher proportion of phenotypic variance observed on these traits was due to the larger proportion of genotypic variance. According to Miller et al., (1957), these traits can be utilized inbreeding programe to evaluate castor accessions for seed yield by using few replicates, location and years.
| Traits | σ2p | σ2g | σ2e | PCV% | GCV% | h2% | GA | GAM%) |
|---|---|---|---|---|---|---|---|---|
| DIF | 8.740 | 2.56 | 6.18 | 3.88 | 2.10 | 0.29 | 1.79 | 2.34 |
| D50F | 10.120 | 2.83 | 7.29 | 3.08 | 1.63 | 0.28 | 1.84 | 1.78 |
| DM | 12.763 | 1.10 | 11.66 | 2.62 | 0.77 | 0.09 | 0.64 | 0.47 |
| PHt | 4308.143 | 3649.17 | 658.97 | 23.34 | 21.49 | 0.85 | 114.70 | 40.79 |
| NoR | 18.897 | 11.48 | 7.42 | 23.20 | 18.08 | 0.61 | 5.45 | 29.06 |
| LMR | 116.433 | 69.04 | 47.39 | 19.30 | 14.86 | 0.59 | 13.20 | 23.61 |
| Noc | 240.607 | 236.52 | 4.09 | 33.51 | 33.22 | 0.98 | 31.46 | 67.95 |
| Nno | 31.020 | 29.04 | 1.98 | 24.17 | 23.39 | 0.94 | 10.76 | 46.69 |
| NL | 7.317 | 5.99 | 1.33 | 11.26 | 10.18 | 0.82 | 4.57 | 19.00 |
| NoBr | 21.890 | 21.23 | 0.66 | 34.15 | 33.63 | 0.97 | 9.36 | 68.33 |
| SW | 36.220 | 15.64 | 20.58 | 13.41 | 8.81 | 0.43 | 5.36 | 11.95 |
| SYLD | 9596.87 | 2460.63 | 7136.24 | 7.93 | 4.01 | 0.26 | 51.82 | 4.19 |
Table 5. Variances for the 12 characters of the 6 castor genotypes.
The phenotypic and genotypic variances (>20%), were obtained from all traits i.e., for Plant height, Length of main racem, Number of capsules per plant, Number of nodes per plant, Number of branches per plant, hundred seed weight and seed yield per hectare. indicating high influence of the environment on these traits at the testing sites.
Generally, the GCV values were lower than that of PCV in the testing site. The relatively larger differences between PCV and GCV for the rest of the traits suggests the high contribution of the environmental variance to the phenotypic variance.
The higher value of genotypic coefficient of variability (>20%) was obtained for plant height number of capsules per plant, number of nodes per plants, and number of branches per plants (Table 5) indicating that these traits were least affected by the environment. Genotypic coefficient of variation indicates the genetic variability present in various quantitative characters without the level of heritability. Genotypic coefficient of variation together with heritability estimates would give the best indication of the amount of gain due to selection (Johnson et al., 1955).
The heritability estimates were ranged from 9% for days to maturity to 98% for number of capsules per plant. When heritability of a character is very high (>80%), selection for such character may be fairly easy owing to close correspondence between the genotypes and the phenotypes arising from a relatively smaller contribution of the environment to the phenotype (Singh, 1990). For a character with low heritability (<40%), selection may be considerably difficult or virtually impractical due to the masking effect of environment on the genotypic effects (Singh,1990). Thus, in the present study, selection of genotypes based on number capsules per plant would be more satisfactory to increase seed yield of castor.
The genetic advance and genetic advance as percent of mean was larger for plant height and number of capsules per plant; moderate for number of nodes per plant and seed yield per hectare.; and lowest for remaining characters (Table 5). Johnson et al. (1955) indicated that the estimate of heritability and genetic advance should always be considered simultaneously as high heritability is not always associated with high genetic gain. The utility of heritability estimates increased when they are used in conjunction with genetic advance expressed on a percentage of mean (Johnson et al., 1955; Allard, 1960). In addition, Panes (1957) reported that association of high heritability with high genetic gain is due to additive gene effect. In the present study, the overall highest value of heritability and genetic advance as percent of means was found higher for number of capsules per plant, plant height, number of nodes per plants, number of branches per plants (Table 5). Therefore, selection based on these traits could predict the performance of the genotypes.
Conclusion
Highly significant (P<0.01) differences among varieties were observed in the testing site for days to plant height, number of capsules per plant, number of nods per plant, nod length, number of branches per plant and seed yield per hectare. Seed yield ranged from 1114 to 1451.27 kg/ha, and the mean value was 1235.95 kg/ha. The top yielders included Acc#95, Acc#82, and Hiruy, with 1451.27, 1294.03, and 1260.27 kg/ha, respectively. Estimates of genetic variance ranged from 1.1 for number of days to maturity to 3649.17 for plant height. The range of phenotypic variance was ranged 7.32 for node length to 9596.87 for Seed yield in kg per ha.
Conflict of Interest
The authors declare that there is no conflict of interest on this paper.
Acknowledgement
The authors would like to acknowledge Ethiopian Institute of agricultural Research, Wondo Genet Agricultural Research Center for facilitation and support during undertaking the research.
References
Allard, R.W. (1960). Principles of plant breeding. John Willey and Sons. Inc. New York.
Anjani, K. (2012). Castor genetic resources: A primary gene pool for exploitation. Industrial Crops and Products, 35:1-14.
Google Scholar, Crossref, Indexed at
Burton, G.W., Devane, D.E. (1953). Estimating heritability in tall fescue (Festuca arundinacea) from replicated clonal material 1. Agronomy Journal, 45:478-481.
Falconer, D.S., Mackay, T.F.C. (1996). Introduction to quantitative genetics, Longman. Essex, England, pp:254-256.
Gana, A.K., Yusuf, A.F., Apuyor, B. (2013). Castor oil plant and its potential in transformation and industrialization of under developing nations in the world. Advanced Journal of Agricultural Research, 1:72-79.
Hallauer, M., Wricke, W. (1986). Standard errors of estimates of error and genotypic variance components.
Johnson, H.W., Robinson, H.F., Comstock, R.E. (1955). Estimates of genetic and environmental variability in soybeans 1. Agronomy Journal, 47:314-318.
Miller, P.A., Williams Jr, J.C., Robinson, H.F., Comstock, R.E. (1958). Estimates of genotypic and environmental variances and covariances in upland cotton and their implications in selection 1. Agronomy Journal, 50:126-131.
Panse, V.G., Sukhatme, P.V. (1957). Genetics of quantitative characters in relation to plant breeding. Indian Journal of Genetics, 17:318-328.
SAS, S. (2002). User’s guide, version 9.0 SAS Institute Inc. Cary. NY.
Singh, R.K. (1985). Biometrical methods in quantitative genetic analysis. Kalyani Pub. Ludhiana. New Delhi, Revised Ed., p:318.
Weiss, E.A. (1983). Oilseed crops. Longman Group Ltd.
Author Info
K.W. Hussen*Citation: Hussen, K.W. (2023). Adaptability evaluation of castor bean (Ricinus communis L.) genotypes at wondogenet, Ethiopia. Ukrainian Journal of Ecology. 13: 12-19.
Received: 01-Jun-2023, Manuscript No. UJE-23-111009; , Pre QC No. P-111009; Editor assigned: 03-Jun-2023, Pre QC No. P-111009; Reviewed: 15-Jun-2023, QC No. Q-111009; Revised: 22-Jun-2023, Manuscript No. R-111009; Published: 29-Jun-2023, DOI: 10.15421/2023_459
Copyright: This is an open access article distributed under the terms of the Creative Commons Attribution License, which permits unrestricted use, distribution, and reproduction in any medium, provided the original work is properly cited.