
Research - (2021) Volume 0, Issue 0
Forecast of the temperature of self-heating of plant raw materials in a hearth of the plate shape
V.P. Olshanskiy1* and O.V. Olshanskiy2Abstract
An analytical solution of the differential equation of nonstationary thermal conductivity for a semi-infinite array of raw materials is constructed using the Fourier series and the integral cosine transformation. The array is bounded only by one of the spatial coordinates, in the direction of which a narrow self-heating hearth of the plate type is extended. The uniform distribution of thermal sources in the center which does not change over time is accepted. After calculating the improper integrals, the temperature increase in the center of the hearth is expressed by a single functional series. For further simplify the calculation, a compact approximation of the probability integral is introduced and an approximate analytical calculation of the sum of the trigonometric series is performed. As a result, the formula for the temperature increase is given by a series of fast convergence and it is shown that for large values of time in a series it can be limited to calculating only the first term. For predict the development of temperature over time, a combination of theory and experiment is provided. The experiment is required to measure the values of the temperature of the raw material at two points in time at the beginning of self-heating to identify the parameters of the hearth. Appropriate graphs have been constructed to simplify identification. The approximate results obtained using them can then be refined by numerical solutions of the corresponding transcendental equation. Examples of identification of parameters of internal thermal sources are given. After identification, the theoretical results become consistent with the experiment and suitable for forecasting the increase in self-heating temperature.
Keywords
Self-heating temperature field, Plant raw materials, Plate-shaped hearth, Analytical solution, Identification of hearth parameters, Temperature rise forecast.
Introduction
Self-heating of plant raw materials in elevator silos has long attracted attention in order to prevent it or eliminate it in a time. It causes an increase in the temperature of raw materials, which worsens the conditions of its storage, and in some cases even leads to fires that damage the environment. Therefore, various means of controlling the process of self-heating are developed and mathematical modeling of temperature fields is carried out, where classical differential equations of nonstationary thermal conductivity are often used. Review of literature sources. In theoretical models of temperature fields (Sergunov, 1987; Vohman and Horshkov and Dehtiarev, 1993; Dehtiarev and Vohman, 1999; Horshkov et al., 2007; Sokolov, 2017; Sukhareva and Shukhanov, 2018; Orlykova and Volinets, 2019) the most common are three variants of self-heating hearths. In form, they are divided into rods (Abramov and Kyrochkyn and Otkydach, 1999; Abramov and Kyrochkyn, 2000; Krysa and Olshanskyi, 2003), layers (Eremenko and Olshanskyi, 2003; Olshanskii, 2001) and nests (Laryn and Olshanskyi and Tryhub, 2003; Olshanskii, 2002; Olshanskyi and Tryhub, 2000; Trihub, 2001). Boundary value problems are solved by both numerical (Vohman and Horshkov and Dehtiarev, 1993) and analytical methods (Abramov and Kyrochkyn and Otkydach, 1999; Krysa and Olshanskyi, 2003; Laryn and Olshanskyi and Tryhub, 2003). Analytical solutions in series have a slow convergence because they describe localized temperature fields. The use of integral transformations, in some cases, gives compact closed calculation formulas (Eremenko and Olshanskyi, 2003; Laryn and Olshanskyi and Tryhub, 2003), which are convenient for solving the inverse problem of thermal conductivity associated with the identification of the parameters of the self-heating hearth. Here we use an integral transformation and a trigonometric series to conduct a theoretical study.
Materials and Methods
A two-dimensional differential equation of nonstationary thermal conductivity was used to derive the formula for forecasting the increase in the excess temperature of plant raw materials. Its analytical solution is constructed by combining the integral cosine transform and the Fourier series. To accelerate the convergence of the series, an approximation of the probability integral and an Pade-type approximation for the tangent are introduced. This made it possible to approximate the sum of a number of slow convergences in analytical form. As a result, the increase in excess temperature in time is expressed by a number of rapid convergences, which simplifies the implementation of the obtained solution of the thermal conductivity equation. It provides for clarification of the theoretical formula, ie the values of the parameters of the internal thermal source (self-heating hearth), which are included in it, by experimentally measuring the values of excess temperature of raw materials at two different points in time. To identify the parameters of the thermal source according to the experimental data, the corresponding transcendental equation is compiled. An approximate graphical solution is suggested. After the identification, the constructed solution of the thermal conductivity equation becomes suitable for the calculation of the forecast of the increase in the self-heating temperature. Therefore, the forecast is based on the theoretical and experimental method.
Results and Discussion
To determine the distribution of excess temperature in the raw material T = T (x,y,t) solve the differential equation:

in which a = λ/(ρc) is the coefficient of thermal conductivity of raw materials; λ is its thermal conductivity coefficient; ρ,c-respectively, the specific weight and specific heat of raw materials; q*=2q0h0-density of thermal sources; q0 is the specific gravity; H(z) is the unit Heaviside function; δ(y) is the delta function; x,y-spatial coordinates; t-time; x0 is the coordinate of the center of a narrow hearth having a width of 2h0.
The cross section of the array of raw materials is shown in Fig. 1.

Fig 1. Calculation scheme.
The array is considered to be infinite in the direction of the oy axis, and the self-heating center of small width is elongated in the direction of the ox axis. The dimensions of the cell and array in the direction of this axis are denoted by h and l, respectively. At the edges of the array: x=0; l the excess temperature T (x,y,t) is considered equal to zero. In addition, we accept at the beginning of self-heating T (x,y,0) =0.
The use of the model of an array of infinite size is possible due to the weak thermal conductivity of plant raw materials, when the temperature field is localized for a long time in the vicinity of the self-heating center.
To construct the solution of equation (1) we use the integral cosine transformation:

In the image space, equation (1) takes the form:

It was taken into account that:
The solution of equation (2) is given in the form of a Fourier series:

Where αm=mΠ/l.
Substitution (3) in (2) gives many equations:

With unknown functions: fm = fm (β,t); m = 1,2,...
Equations (4) have solutions:

Substituting them in (3) gives the series:

Describing the cosine field of temperature images.
Returning (5) to the space of the originals, we obtain the formula for the distribution of excess temperature in the raw material array:

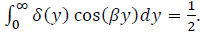
Next, we simplify solution (6) by limiting ourselves to determining the maximum temperature increase in the center of the self-heating hearth located in the center of the raw material array. Putting in (6) y = 0; x = x0 = 0.5l, we obtain the maximum temperature increase:

When calculating the integrals, consider that (Gradshteyn and Ryizhik, 1962, c. 352):

Here Φ (z) is the probability integral related to the tabulated special functions (Abramoviz and Stigan, 1979; Yanke et al., 1977).
Then:

To simplify the implementation of solution (7), we can use the approximation of the probability integral printed in (Abramoviz and Stigan, 1979, c. 122), where:
The error of this approximation is smaller 10-4.
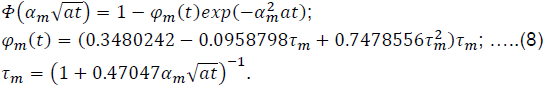
In order to further simplify formula (7), we calculate the approximate sum of the series:

In the directory (Prudnikov et al., 1983, c.732):
To integrate in (10) we use an approximation:
In the interval z ∈ [0;0.8] the approximation error (11) is less than 0.02%. So at z = 0.8 it gives tgz ≈ 1.0294, while more accurate tgz ≈ 1.0296.
Substituting (11) into (10), after carrying out the analytical integration by the Newton-Leibniz formula, we obtain an approximate closed expression of the sum of the series:

Using the results of work (Olshanskyi et al., 2009, c.239) or (Tymoshenko and Voinovskyi-Kryher, 1963, c.186), we have:
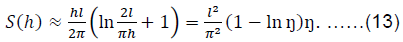
For estimate the errors of formulas (12), (13), in Table 1 shows the values of S(h)/l2, obtained in three ways for different ratios of h/l. In addition to approximate analytical calculations, a more accurate computer calculation of the sum of the series was performed (9).
| By computer | Formula (12) | Formula (13) | |
|---|---|---|---|
| Values 100 S(h)l2 | |||
| 0.1 | 4.533 | 4.533 | 4.538 |
| 0.2 | 6.833 | 6.833 | 6.869 |
| 0.3 | 8.245 | 8.245 | 8.367 |
| 0.4 | 9.029 | 9.029 | 9.325 |
| 0.5 | 9.281 | 9.281 | 9.880 |
Table 1. Values 100 S(h)l2.
As you can see, formula (12) gives much smaller errors than (13).
As a result, instead of (7), we obtain the following formula for the temperature increase in the center of the cell:

Where φm (t) i S(h) are served by expressions (8) i (12).

The obtained values of temperature increase are recorded in Table 2, where in a series of m was calculated by N members.
| t, days | N=1 | N=3 | N=5 | N=10 | N=20 |
|---|---|---|---|---|---|
| Value T (0.5l; 0; t)°C | |||||
| 5 | 8.890 | 8.480 | 8.378 | 8.389 | 8.389 |
| 10 | 12.358 | 11.884 | 11.862 | 11.863 | 11.863 |
| 20 | 17.113 | 16.735 | 16.733 | 16.733 | 16.733 |
| 50 | 25.814 | 25.705 | 25.705 | 25.705 | 25.705 |
| 100 | 34.104 | 34.091 | 34.091 | 34.091 | 34.091 |
| 200 | 42.719 | 42.719 | 42.719 | 42.719 | 42.719 |
Table 2. Values T(0.5l;0;t) at different t.
The convergence of the series accelerates with increasing t and already at T > 50 it is possible to calculate only one member of the series.
According to the stated theory for the forecast of development of temperature, besides thermo physical characteristics of raw materials and the size of an array, it is necessary to set also parameters of the hearth q*i h. For determine them, we use the theoretical and experimental method, which involves measuring the temperature in the center of the hearth at two points in time. Assume that the temperature measured at t = t1 is equal to T1, and at t = t2-equal to T2. Denote their relationship by the symbol  . Then according to (14) the hearth size h is the root of the transcendental level:

This equation has to be solved by numerical methods. But at the approximate identification of the parameters of the hearth, you can use the graphs presented in Fig. 2.

Fig 2. Dependences of h/l on z.
The graph 1 is built for t2 = 3t1=15 t_2=3t_1=15 days, and graph 2 for t2=4t1=16 days. After determined h, we can calculate q*:

After determining h i q*, formula (14) can be used to calculate the temperature rise in the center of the hearth for other values of t > t2.
Consider examples of identification of hearth parameters using graphs in Fig. 2.
Example 1. Suppose that the measurement results at t1=5 days T1 = 9°C, and at t2 = 15 days T2 = 15,3°C. Then the temperature ratio Z=1.7. For it on the graph 1 we have 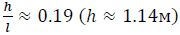 . By formula (15) we find that
 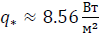 . In order to verify, we substitute the results of identification in formula (14). We obtain at t = 5 days T1 = 8,98°C and at t = 15 days T2 = 15,29°C, which are close to the values of temperatures involved in the identification.
Example 2. Calculate q* and h, if at t = 4 days T1=6°C, and at t = 16 days T2=11,4°C. In graph 2, which in Fig. 2, for the ratio Z=1.9 we have 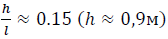 . Using this h, the calculation by formula (15) gives
  . Substituting the results of identification in formula (14), we obtain at t = 4 days T1 ≈ 5,98°C, and at t = 16 days T2 ≈ 11,4°C, which confirms the high accuracy of identification.
Conclusion
In our work we combined theory with experiment. The theory makes it possible to predict the development of temperature over time in the hearth of the plate shape, which occurs in the array of plant raw materials. For this, in addition to calculations, it is necessary to make two measurements of the temperature in the center of the hearth at different points in time at the beginning of the self-heating process and identify the parameters of the hearth. Then the theory, consistent with the experiment, becomes suitable and convenient for the estimated forecast of temperature rise over time.
References
Abramov, Yu., Kyrochkyn, A., Otkydach, D. (1999). Mathematical model of the thermal field of a grain embankment. Pozharovzrivobezopasnost, 2:25-29 (In Russian).
Abramov, Yu., Kyrochkyn, A. (2000). Mathematical models of thermal fields of the embankment of plant raw materials taking into account the ambient temperature. Pozharovzrivobezopasnost, 3:21-27 (In Russian).
Abramoviz, M, Stigan I. (1979). Special functions reference (with formulas, graphs and math tables). Moskow, Nauka, p:832 (In Russian).
Dehtiarev, A., Vohman, L. (1999). Optical method for detecting spontaneous combustion and burning in storage of agricultural raw materials. Pozharovzrivobezopasnost, 6:37-41 (In Russian).
Eremenko, S., Olshanskyi, V. (2003). Problems of unsteady thermal conductivity during self-heating of raw materials by plast hearths.-Kharkov, KhNADU, p:164 (In Russian).
Gradshteyn, I., Ryizhik, I. (1962). Tables of integrals, sums, series and products.-Moskow, Fizmatgiz, p:1100 (In Russian).
Horshkov, V., Korolchenko, Y, Kozakov, A., Sokolov, D. (2007). Determination of induction time for focal spontaneous combustion of materials. Pozharnaia Bezopasnost, 1:66-70 (In Russian).
Krysa, Y., Olshanskyi, V. (2003). Stationary temperature fields during self-heating of plant raw materials (their calculation and reconstruction). Kyev, Pozhynformtekhnyka, p:296 (In Russian).
Laryn, A., Olshanskyi, V., Tryhub, V. (2003). Problems of unsteady thermal conductivity during self-heating of raw materials by nesting centers. Kharkov, KhNADU, p:160 (In Russian).
Olshanskii, V. (2001). Temperature field of bedded self-heating of a bank in a silo. Combustion, Explosion and Shock Waves, 37:53-56.
Olshanskii, V. (2002). Temperature field of cluster self-heating of bank in a silo. Combustion, Explossion and Shock Waves, 38:728-732.
Olshanskyi, V., Tryhub, V. (2000). To the calculation of the self-heating temperature of plant raw materials by a nesting spherical hearth. Vestnyk KhHPU. Novie reshenyia v sovremennikh tekhnolohyiakh. Kharkov, KhHPU, 118:43-45 (In Russian).
Olshanskyi, V., Lavynskyi, V., Mazorenko, D. (2009). Analytical methods for calculating locally loaded thin shells.-Kharkov, KhNTUSKh, p:366 (In Russian).
Orlykova, V., Volinets, V. (2019). Study of focal spontaneous combustion of organic substances. Pozharnaia Bezopasnost: Problemi, Puty Sovershenstvovanyia, 2:169-177 (In Russian).
Prudnikov, A., Brichkov, U., Marichev, O. (1983). Integrals and series. Special functions, Moskow, Nauka, p:752 (In Russian).
Sergunov, V.S. (1987). Remote control of grain temperature during storage. Moskow, Agropromyzdat, p:174 (In Russian).
Sokolov, D. (2017). Evaluation of the possibility of spontaneous combustion of grain in the silos of the elevator. Innovatsyonnie Tekhnolohyy Proyzvodstva Y Khranenyia Materyalnikh Tsennostei Dlia Hosudarstvennikh Nuzhd, 7:284-287 (In Russian).
Sukhareva, A., Shukhanov, S. (2018). The state of the question of self-heating of the grain mass in stacks. Yzvestyia Orenburhskoho Hosudarstvennoho Ahrarnoho Unyversyteta, 3:165-168 (In Russian).
Tymoshenko, S., Voinovskyi-Kryher, S. (1963). Plates and shells. Moskow, Fyzmathyz, p:636 (In Russian).
Trihub, V. (2001). Identification of the parameters of the nesting center during self-heating of plant raw materials. Problemy Pogarnoy Bezopasnosty. Kharkov, Folio, 10:187-190 (In Russian).
Vohman, L., Horshkov, V., Dehtiarev, A. (1993). Fire safety of elevators. Moskow, Stroiyzdat, p:288 (In Russian).
Yanke, E., Emde, F., Lesh, F. (1977). Special functions. Moskow, Nauka, p:344 (In Russian).
Author Info
V.P. Olshanskiy1* and O.V. Olshanskiy22Kharkiv State University Food Technology and Trade, 333 Klochkivska St., Kharkiv, 61051, Ukraine
Citation: Olshanskiy, V.P., Olshanskiy, O.V. (2021). Forecast of the temperature of self-heating of plant raw materials in a hearth of the plate shape. Ukrainian Journal of Ecology 11 (9), 44-48.
Received: 08-Oct-2021 Accepted: 13-Nov-2021 Published: 20-Nov-2021
Copyright: This is an open access article distributed under the terms of the Creative Commons Attribution License, which permits unrestricted use, distribution, and reproduction in any medium, provided the original work is properly cited.