
Research Article - (2022) Volume 12, Issue 2
Land use land cover changes and its implication on ecotourism in hawassa city and its surroundingsâ
S. Getahun1* and M. Yoseph2Abstract
In recent years, ecotourism has flourished and attracts ecotourists who visit the ecological, cultural, landscapes, city parks, lakes and related resources around the world. The study was conducted with the aim analyzing the dynamics of land use land cover change for the last three decades on development of ecotourism in and around Hawassa city. Four sets of remotely sensed data, TM for 1985 and 1995, ETM+ for 2005 and OLI for 2017 with a time span of thirty years were used To assess the LULC change on ecotourism potential and it was obtained and processed using Arc GIS 10.3 and ENVI 5.1. Five LULC types, namely Built up (settlement), forest, cropland, grassland and water body were identified. Results revealed that increment of built-up area by about 15.63% and decrement of water body by 18 hectare in last three decade have negatively affected ecotourism development. Hence, appropriate measures need to be employed to reduce the dramatic change in land use and to harmonize environmental conservation with human livelihood.
Keywords
Ecotourism, GIS, Hawassa, Land use land cover.
Introduction
Ecotourism industry is one of the sectors that are highly attended by tourists. It is a concept that has evolved with the rapid growth of tourism during the past 20 years among the bodies responsible for the protection of the environment and the people living around protected areas. According to United Nations World Tourism Organization (UNWTO, 2015), an ever-increasing number of destinations worldwide have opened up to, and invested in tourism, turning it into a key driver of socio-economic progress through the creation of jobs and enterprises, export revenues, and infrastructure development. It emerged as an alternative form of tourism in the 1990s to mitigate the faults of conventional (mass) tourism in meeting the needs of sustainable development. Ecotourism also establish a durable productive base to allow the local inhabitants and ecotourism service providers to enjoy a sustainable standard of living while offering these services (Bunruamkaew, et al., 2011).
To determine the potentials of tourism activities for a given area, a comprehensive ground surveys, Remote Sensing (RS) and Geographical Information System (GIS) techniques are commonly required. Thus, a meaningful relation can be established among various tourism activities. GIS is considered an essential tool for natural resources management which also combines mapped variables to build and analyze new variables (Chang, et al., 2008). As stated by Rahman, 2010., the integration of RS and GIS also play an important role in ecotourism planning.
Studies on LULC (Lambin, et al., 2001) showed that socio-economic and biophysical variables act as the driving forces of land use changes. Driving forces are generally subdivided into two groups: proximate causes and underlying causes. Proximate causes are the activities and actions that directly affect land use, e.g., wood extraction or road building. Furthermore, studies conducted on LULCC in Ethiopia focus on the dynamics of cover changes and their causes with little attention to address the impacts of such changes on ecosystem services aspect (Tolessa, et al., 2016). Analysis and prediction of LULC changes have significant roles in the understanding of earth-atmosphere interaction, forest fragmentation, biodiversity loss, and future management plans (Olson, et al., 2008; Dayamba, et al., 2016). Land use/cover conversion is single amongst the leading pouring forces on global and local environmental changes though its impact varies across space and time (Costanza, et al., 2014). Enlargement of farming, sprawl urbanization, deforestation and the day to day activities of mankind resulted in temporal and spatial changes in the land use/cover which in turn affects ecosystem service such as hydrological regulation and soil erosion losses (Rawat, et al., 2015).
Ethiopia holds a massive ecotourism development potential. In that such ecotourism development is getting increasing interest and attention due to the fact that the country has a unique biodiversity, spectacular topographic features and rich cultural resources. Ethiopia’s protected areas, which includes national parks, game reserves, wildlife sanctuaries and other controlled hunting grounds, covers about 14% of the country are most suitable for ecotourism development (Teressa, 2017). But, it is still in its infancy.
Hawassa city is richly endowed with ecotourism potentials with much reminiscent of the mountains, city parks, lakes, wetlands and different fauna and flora. But the growing demand of space for human settlement and commercial purposes are reducing the amount and size of natural resources for sustainable ecotourism development in study area.
There have been studies of LULC changes but it lacks its implication to ecotourism status in study area which is an important consideration in the design of ecotourism development and management and of appropriate sustainable land management practices, strategies and policies that best fit to local conditions in the country. Therefore, this research work was proposed to contribute to filling these gaps.
Materials and Methods
Study area
Hawassa city is serving as the capital of Southern nation’s nationalities and people’s regional state and Sidama zone. It is located at the Eastern shore of Lake Hawassa about 273 km South of Addis Ababa (Fig. 1). Geographically, it is situated between 60 55′ to 70 6′ latitude North and 380 25′ to 380 34′ longitudes East with an elevation of 1708 meter above sea level. It is bounded by the lake in the West, Oromia region in the North, Wondogenet woreda in the East and Shebedino woreda in the South. Based on the result of CSA in 2017 the projected populations of the study area to be 387,087 people, out of this 199,209 are males and 187,878 are females. The minimum monthly average temperature is 9.7°C and monthly average maximum temperature is 31.6°C recorded as the Afar depression in the North East Ethiopia. The area has even extended period of wet season (March-October with mean monthly rainfall varying from 85 to 133 mm). Maximum annual rainfall is 1188.9 mm and annual minimum rain fall is 632.5 mm (HCA, 2017).

Fig 1. Study area map.
Data sources and method of analysis
To meet the objective of the study, ground control points consisting of different LU/LC features and their location points were recorded using a GPS as the reference data to evaluate the results. The images were freely obtained (downloaded) from the USGS Glovis website (http://glovis.usgs.gov/). Arc GIS 10.3 and ENVI5.1 software’s were used to classify the image and to delineate the study area through designed flow in Fig. 2.

Fig 2. Flow chart of the methodology.
For classification of the land use types based on the surface coverage, satellite images at different years were used. The images were extracted to Tiff formats for processing and the detail of image properties are summarized in Table 1.
| S.No | Image | Sensor | Acquisition time | Producer | Used bands |
|---|---|---|---|---|---|
| 1 | 1985 | TM | LT05_L1TP_168055_19850323_20180112_01_T1.tar | USGS | 1-5 and 7 |
| 2 | 1995 | TM | LT05_L1TP_168055_19950319_20170110_01_T1.tar | USGS | 1-5 and 7 |
| 3 | 2005 | ETM+ | LE07_L1TP_168055_20050321_20170116_01_T1.tar | USGS | 1-5 and 7 |
| 4 | 2017 | OLI | LC08_L1TP_168055_20170315_20170328_01_T1.tar | USGS | 1-5 and 7 |
Table 1. The characteristics of landsat satellite data used in this study.
Present and past information on land cover and land use change for the study area was generated from remotely sensed data. Satellite image from TM for 1985 and 1995, ETM+ for 2005 and OLI for 2017 was obtained from USGS. These four years satellite images, 1985, 1995, 2005 and 2017 used in land use land cover change analysis are presented in false color in Fig. 3.

Fig 3. False colour composite of 1985, 1995, 2005 and 2017.
It was believed that the time gap of about thirty years between the four satellite imagery is wide enough to show changes and trends in land use and land cover change over ecotourism development in Hawassa city and surrounding area.
From visual and digital interpretations of the satellite imagery, different land use land cover categories were distinguished in Table 2, so that it was possible to investigate changes that occurred since 1985 to 2017. Image classification refers to the task of extracting information of classes from a multiband raster image.
| Land use Name | Description of Land Classes |
|---|---|
| Built-up(Settlement) | Includes of built up area, urban fabric, industrial, commercial and transport units, infrastructures, roads, buildings |
| Forest | Includes forests, plantations, natural forest, shrub and/or herbaceous vegetation association |
| Cropland | crop grown agricultural areas |
| Grassland | Includes grass |
| Water body | Water courses, water bodies, lake |
Table 2. Description of land covers categories for change detection in the study area.
For this study, land cover maps were generated based on the pixel based supervised classification through a number of processes. Image enhancement and composition were applied for better determination of land cover classes. The next step was performing the image classification using the Arc GIS. In this stage a number of both classification and reclassification procedures were used in order to improve the classification and neglect misclassified cells. All the data processes were performed by applying different and appropriate software in accordance with the data type. The software packages that were used for the study includes Arc GIS ver.10.3 and ENVI 5.1. Spatial enhancement such as resolution and merging were again applied for better visualization of the image.
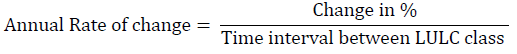
To calculate annual rate of change for each land use class, the difference between final year (2017) to initial year (1985) which represents magnitude of change between corresponding years was divided by the number of study using the following Equation as stated by Meshesha et al., 2016:
Results and Discussion
Land use and land cover change detection from 1985 to 2017
An important aspect of change detection is to determine what is actually changing to what i.e., which land use class is changing to the other. This information will also serve as a vital tool in management decisions. The overall accuracies performed in this study period 1985 was 94.1%, in 1995 was 89.1%, 2005 was 86.6% and during 2017 it was 89.5% as stated in the appendix. As mentioned by Weng, 2012, for a reliable land cover classification, the minimum overall accuracy value computed from an error matrix should be 85%. So, the overall accuracies for all maps were above 85% based on criteria (Fig. 4).

Fig 4. Land use and land cover map of A, B, C and D for 1985, 1995, 2005 and 2017 respectively.
Land use and land cover from 1985 to 2017
From the 1985 land use and land cover map interpretation; croplands cover about 49% relatively half of the study area. Grassland accounted for about 29.45% whereas forestland covers about 14.62% of the land area of the study area. From the 1995 land use and land cover map interpretation, the greatest share of land use and land cover as indicated in Table 3 was accounted by cropland for about 33.9%. Grassland and forest take the share of 29.19% and 26.40% respectively.
| Land use Name | Coverage of 1985 | Coverage of 1995 | Coverage of 2005 | Coverage of 2017 | ||||
|---|---|---|---|---|---|---|---|---|
| In Ha | In % | In Ha | In % | In Ha | In % | In Ha | In % | |
| Built-up (Settlement) | 1005.17 | 6.30 | 1605.00 | 10.06 | 2352.92 | 14.75 | 3498.30 | 21.93 |
| Forest | 2332.45 | 14.62 | 4211.30 | 26.40 | 4331.94 | 27.16 | 4952.55 | 31.05 |
| Cropland | 7836.49 | 49.13 | 5407.47 | 33.90 | 4572.78 | 28.67 | 4396.23 | 27.56 |
| Grassland | 4697.00 | 29.45 | 4655.59 | 29.19 | 4621.00 | 28.97 | 3042.07 | 19.07 |
| Water body | 79.89 | 0.50 | 71.64 | 0.45 | 72.36 | 0.45 | 61.85 | 0.39 |
| Total | 15951 | 100.0 | 15951 | 100.00 | 15951 | 100 | 15951 | 100.00 |
Table 3. Land use and land cover from 1985 to 2017.
The proportion of the land use and land cover classes in 2005 of the study area is the grassland, cropland and forest area coverage unit was about 28.97%, 28.67% and 27.16% of the total area respectively. Land category under the built-up (settlement) and water accounted 14.75% and 0.45 % respectively. In 2017 the greatest share of land use and land cover from all classes is forest, which contributes an area of 31.05% of the total area.
Land use and land cover change detection from 1985 to 2017
In general from 1985 to 2017, after three decades, the forest and settlement increased by 16.43% and 15.63% respectively, whereas grassland and cropland decreased by 10.38% and 21.57% respectively. The reason for the increment of forest was due to practice of planting trees such as Eucalyptus in the periphery of Hawassa for market interest by local communities and practice of planting by municipality, public awareness for the use vegetation by planting urban forestry for soil and water conservation, shading and ventlet their compounds and governments strategies that encourage afforestation in the town. In addition hillside of mount Tabor, thousands of Eucalyptus and Acacia treeplantations by Green Hawassa Project to prevent soil erosion on Lake Hawassa was other contributing factor for the increment of forest. This result was in line with Atalel, 2014, that the increase in forest and semi-natural areas was associated to an increasing trend of plantation of eucalyptus tree near to water bodies in Bahir Dar. In addition the main finding in this study shows that there is a major increase in forest covers particularly man made forests. But it is covered by exotic plants dominantly with Eucalyptus globulus trees which is in line with Wubie et al., 2016, found a significant increase in cultivated land and settlement and a decrease in forest land, grassland, and wetland over 48 years (1957-2005) in Gumara Watershed of Lake Tana basin, Northwestern Ethiopia. However it is contrary to the work of Tegene, 2002, and Tekle and Hedlund, 2000, who reported 58 percent decline in forest cover of Derekolli catchment and 51 percent decline of the forest cover in Kallu district of southern Wello. Asmamaw et al., 2011, have also shown the expansion of forest land during the study period between 1958 and 2006 in Gerado Catchment of Northeastern Ethiopia (Table 4).
| LULC Type | Trends of LULC Changes | |||||||
|---|---|---|---|---|---|---|---|---|
| 1985-1995 | 1995-2005 | 2005-2017 | 1985-2017 | |||||
| Area Change ha | Area Change % | Area Change (ha) | Area Change % | Area Change (ha) | Area Change % | Area Change (ha) | Change % | |
| Built-Up | 599.83 | 3.76 | 747.92 | 4.69 | 1145.38 | 7.18 | 2493.13 | 15.63 |
| Forest | 1878.85 | 11.78 | 120.64 | 0.76 | 620.61 | 3.89 | 2620.10 | 16.43 |
| Cropland | -2429.02 | -15.23 | -834.69 | -5.23 | -176.55 | -1.11 | -3440.26 | -21.57 |
| Grassland | -41.41 | -0.26 | -34.59 | -0.22 | -1585.93 | -9.90 | -1654.93 | -10.38 |
| Water body | -8.25 | -0.05 | 0.72 | 0 | -10.51 | -0.06 | -18.96 | -0.11 |
Table 4. Trends of LULC changes in the Hawassa City, Southern Ethiopia.
Expansion on construction of industrial park, commercial constructions, Hawassa university expansion, and Hawassa international stadium are the main factors for increment of built-up area. Atalel, 2014, reported that the conversion of agricultural land to built-up areas could be related to increment of population and faster economic development in Bahir Dar area. Cropland and grassland areas decreased due to the expansion of settlement which resulted in a decrease of agricultural product this result in line with Yesuph and Dagnew, 2019, reported the consistent increase in settlement area at the expense of Afro-alpine and sub-Afro-alpine vegetation areas between 1973 and 2017 in Beshillo Catchment of Blue Nile Basin, Northeastern Highlands of Ethiopia.
LULC changes implications for ecotourism
Pertaining to the ecotourism potential of the area in relation to land use land cover change dynamics, expansions of settlement/built-up area about 15.63% in the last three decade have great impact on conservation of natural resource. In the study area, the LCC shows increment of forest (i.e., mainly plantation forest) but the area was covered by mono-species especially eucalyptus tree. This shows the quality of forest and its diversity is declining through time which implies that the less diverse the vegetation becomes less attractive for people and animals. What matter is not the cover but the quality (diversity) of the forest and that is important for sustainability of biodiversity and ecotourism development.
In addition one of the most tourist attraction in the city i.e. Hawassa Lake, is decreasing from time to time due to sedimentation. Studies (Minale, et al., 2017; Kasahun, 2018) conducted in different parts of Ethiopia reported that the life of both artificial and natural lakes is threatened by a high sedimentation rate. Eyasu et al., 2019, also reported that rapid population growth, agricultural expansion, environmental fluctuations, degradation of natural resource and loss of biodiversity are the most visible socio-economic and environmental problem in the Central Rift Valley area and all these put pressures on the water bodies. Due to the above reasons the LULC changes have negative impact on ecotourism development.
Conclusion
The quantitative evidence obtained through interpretation of satellite image by integrating GIS and remote sensing techniques indicated that the study area has undergone significant LULC changes since 1985. During the analysis period the three decade data (1985-2017), the proportion of built-up (settlement) areas and forest areas were increased in the last three decades. There was an increase of built up areas from 6.3% in 1985 to 10.06% in 1995, 14.75% in 2005 and 21.93% of total area in 2017. Expansion of construction of industrial park, commercial constructions, Hawassa university expansion, and Hawassa international stadium are the main factors for increment of built-up area.
Therefore, there should be strategic planning to monitor abrupt urban expansions of the town with concerned governmental and non governmental bodies. The loss of natural resources will prevent Hawassa city from being ecotourism destination. So, responsible body should provide awareness to consider the effect on biodiversity preservation.
References
Rani, F., Oktavia, R. (2015). Upaya united nations world tourism organization (UNWTO) menangani sex tourism di Thailand (2009-2013).
Bunruamkaew, K., Murayama, Y. (2011). Site suitability evaluation for ecotourism using GIS and AHP: A case study of SuratThani province, Thailand. Procedia-Social and Behavioral Sciences, 21:269-278.
Chang, N.B., Parvathinathan, G., Breeden, J.B. (2008). Combining GIS with fuzzy multicriteria decision-making for landfill siting in a fast-growing urban region. Journal of Environmental Management, 87:139-153.
Lambin, E.F., Turner, B.L., Geist, H.J., Agbola, S.B., Angelsen, A., Bruce, J.W., Xu, J. (2001). The causes of land-use and land-cover change: moving beyond the myths. Global Environmental Change, 11:261-269.
Teressa, D.K. (2017). Ethiopia : changes from “People out Approach” protected area management to participatory protected area management. Insight from Ethiopian Protected Areas, 11:49-55.
HCA. (2017). Socio-economic and geo-spatial data analysis and dissemination core work process. Hawassa, Ethiopia.
Weng, Q. (2012). Remote sensing of impervious surfaces in the urban areas: requirements, methods, and trends. Remote Sensing of Environment, 117:34-49.
Sahalu, A.G. (2014). Analysis of urban land use and land cover changes: a case of study in Bahir Dar, Ethiopia.
Minale, A.S., Belete, W. (2017). Land use distribution and change in lake Tana sub basin. In Social and Ecological System Dynamics, Springer, Cham, pp:357-373.
Gashu, K., Gebre-Egziabher, T. (2018). Spatiotemporal trends of urban land use/land cover and green infrastructure change in two Ethiopian cities: Bahir Dar and Hawassa. Environmental Systems Research, 7:1-15.
CSA. (2013). Population projection of Ethiopia for all regions at wereda level from 2014-2017. Central Statistical Agency of Ethiopia.
Rahman, M.A. (2010). Application of GIS in ecotourism development:a case study in sundarbans, Bangladesh.
Tolessa, T., Senbeta, F., Abebe, T. (2017). Land use/land cover analysis and ecosystem services valuation in the central highlands of Ethiopia. Forests, Trees and Livelihoods, 26:111-123.
Costanza, R., De Groot, R., Sutton, P., Van der Ploeg, S., Anderson, S.J., Kubiszewski, I., Turner, R.K. (2014). Changes in the global value of ecosystem services. Global Environmental Change, 26:152-158.
Rawat, J., Kumar, M. (2015). Monitoring land use/cover change using remote sensing and GIS techniques: A case study of Hawalbagh block, district Almora, Uttarakhand, India. The Egyptian Journal of Remote Sensing and Space Science, 18:77-84.
Olson, J.M., Alagarswamy, G., Andresen, J.A., Campbell, D.J., Davis, A.Y., Ge, J., Wang, J. (2008). Integrating diverse methods to understand climate-land interactions in East Africa. Geoforum, 39:898-911.
Dayamba, S.D., Djoudi, H., Zida, M., Sawadogo, L., Verchot, L. (2016). Biodiversity and carbon stocks in different land use types in the Sudanian Zone of Burkina Faso, West Africa. Agriculture, Ecosystems and Environment, 216:61-72.
Meshesha, T.W., Tripathi, S.K., Khare, D. (2016). Analyses of land use and land cover change dynamics using GIS and remote sensing during 1984 and 2015 in the Beressa Watershed Northern Central Highland of Ethiopia. Modeling Earth Systems and Environment, 2:1-12.
Tegene, B. (2002). Land use/land cover changes in the Derekolli catchment of the South Welo zone of Amhara region, Ethiopia.
Tekle, K., Hedlund, L. (2000). Land cover changes between 1958 and 1986 in Kalu District, southern Wello, Ethiopia. Mountain Research and Development, 20:42-51.
Wubie, M.A., Assen, M., Nicolau, M.D. (2016). Patterns, causes and consequences of land use/cover dynamics in the Gumara watershed of lake Tana basin, Northwestern Ethiopia. Environmental Systems Research, 5:1-12.
Yesuph, A.Y., Dagnew, A.B. (2019). Land use/cover spatiotemporal dynamics, driving forces and implications at the Beshillo catchment of the Blue Nile Basin, North Eastern Highlands of Ethiopia. Environmental Systems Research, 8:1-30.
Asmamaw, L.B., Mohammed, A.A., Lulseged, T.D. (2011). Land use/cover dynamics and their effects in the Gerado catchment, northeastern Ethiopia. International Journal of Environmental Studies, 68:883-900.
Elias, E., Seifu, W., Tesfaye, B., Girmay, W. (2019). Impact of land use/cover changes on lake ecosystem of Ethiopia central rift valley. Cogent Food and Agriculture, 5:1595876.
Author Info
S. Getahun1* and M. Yoseph22Wondogenet College of Forestry and Natural Resource, Hawassa University, Ethiopia
Citation: Getahun, S., Yoseph, M. (2022). Land use land cover changes and its implication on ecotourism in hawassa city and its surroundings. Ukrainian Journal of Ecology. 12:19-25.
Received: 24-Jan-2022, Manuscript No. UJE-22-52344; , Pre QC No. P-52344; Editor assigned: 28-Jan-2022, Pre QC No. P-52344; Reviewed: 08-Feb-2022, QC No. Q-52344; Revised: 14-Feb-2022, Manuscript No. R-52344; Published: 21-Feb-2022, DOI: 10.15421/2022_340
Copyright: This is an open access article distributed under the terms of the Creative Commons Attribution License, which permits unrestricted use, distribution, and reproduction in any medium, provided the original work is properly cited.