
Research - (2021) Volume 0, Issue 0
Spatial analysis of the impact of main agrochemical characteristics of the soil on grain crops yield in the Volyn region
B.V. Matviichuk1*, N.H. Matviichuk1, S.I. Matkovska1 and M.M. Prystavskyi2Abstract
Purpose: Establish patterns of spatial and temporal variability of cereals in the Volyn region in 1965-2017. Methods: Agrarian and ecological methods of multivariate statistics, cluster analysis, geographic information technology. Results: The article presents econometric research techniques for the establishment of interrelation between grain crops yield and exchangeable acidity level, content of main macronutrient elements, and humus in soil. To assess the impact on grain crops, we selected and analyzed the main macronutrient elements of the soil and yield of grain crops in the Volyn region. The agrochemical passport of the field, the land parcel in Ukraine is an integral legal document that contains data on the actual condition of the soil and its changes over time and serves as a basis of the state control over land use. Soil characteristics that are recorded in the agrochemical passport of the field, land parcel every 5 years allow to trace changes in soil quality and, therefore, control quality of land use, detect soil fertility decline, forecast further changes of soil cover. Today, research at the intersection of different sciences holds a specific place in scientific cognition system. We have used econometric techniques for our research to learn the laws of growth and development of agricultural crops. Conclusions: The simulation results demonstrated the statistical significance of the model obtained. Integrated model (R2 >0,65, p-value >0,001), that includes all districts, demonstrated that, if phosphor is applied above the fertilizer application rate by 1 kg and other factors remain unchanged, the grain crops yield decreases by 0.004 dt/ha and, oppositely, if potassium is applied above the fertilizer application rate grain crops yield increases by 0.22 dt/ha, when the content of humus content increases by 1 unit, the yield also increases by 9.21 dt/ha, increase in exchangeable acidity level by 1 unit decreases the grain crops yield by 4.16 dt/ha. Furthermore, the model we have designed allowed us to make a list of certain administrative regions where it is not recommended to apply mineral fertilizers above the norm. Through analysis, we have established regional (district-based) characteristics of grain crops development and got a chance to use this information later for agricultural activities to plan rotation of crops and volume of mineral and organic fertilizers to be applied.
Keywords
Soil condition; Agrochemical survey; Relief; Linear regression; Spatial autoregressive model
Introduction
Spatial econometrics has been recognized as an independent field of world economic science comparatively recently. The notion ‘spatial econometrics’ was first introduced in 1970 by the Belgian economist Jean Paelinck, who was working on the methodology of interrelation study methodology for interregional economic processes. Spatial econometrics is a rather integrated scientific field of scientific cognition in comparison to traditional regional economics as it addresses not only regions and regional systems, but also spatial business and operation patterns, including spatial networks (Nijkamp, P., & Paelinck, J., 1973).
The mission of spatial econometrics as science in economic theories is to overcome stereotypes of ‘exact’ macroeconomics (national economy is addressed as a consistent monoobject) and theoretic comprehension of a vast sphere of territorial phenomena. Spatial path has introduced qualitatively new results to general equilibrium theory, optimization of economy, economic growth, price formation, and international trade. Considerable contribution to the development of economy was made by B. Ohlin, P. Krugman, etc. The researches of the last two decades: theory of regional clusters, ‘new economic geography”, spatial econometrics, spatial institutional economics.
However, in the mid-1990s Local Indicators Of Spatial Association (LISA) were widely accepted and made it possible to analyse contribution of each separate individual observation in global space rather than common patterns existing in space (Anselin, 1988). The assumption about the absence of interrelations between observations may lead to wrong conclusions about interdependencies and cause-and-effect relations between investigated factors. Thus, variation of response in simple regression model may be predetermined by functional dependence of the response on explanatory variables, but also upon broad tendencies that occur inside the whole group observed as a whole. The ignoring factor of spatial relations between objects may be analogous to omitting a variable in the model.
The spatial analysis of the data corresponds to the latest methods that we have implemented to identify the dependency of grain crop production on main agrochemical characteristics of the soil such as Nitrogen (N), mobile phosphorus (25), exchange potassium (25), soil acidity (рН) and total exchangeable bases (Gm). This approach helps identify regional (district-based) peculiarities of the development of grain crops development that can later be useful for production activities to plan the rotation of the company’s crops rotation and the amount of mineral and organic fertilizers to be applied.
In general, agrochemical survey has been carried out in Ukraine at zonal agrochemical laboratories for 50 years already starting from 1964. The Decree of the President of Ukraine dated 22 December 1995 #1118/95 “On agrochemical farms’ introduced agrochemical certification of farmlands and the agrochemical passport of the field, the land parcel; passport example was approved by the Ministry of Agriculture Policy. The Law of Ukraine ‘On state control over land use and protection of lands” stipulates that agrochemical certification of land is one of instruments of the state control over their use and protection.
The main task of the agrochemical certification of farmlands is to determine the quality condition of the soil and its changes resulting from economic activities.
Currently, the agrochemical certification of farmlands is performed by the State Institution ‘Derzhgruntokhorona’ with its 24 accredited research laboratories in each Ukrainian region, including 6 accredited laboratories accredited in accordance with the requirements of DSTU <S/17025 harmonized according to international standards.
Agrochemical certification is achieved through survey tours. According to regulatory documents, the duration of one tour is 5 years, which means that a parcel of land is examined once in 5 years, taking into account characteristics of soil processes, this period is quite sufficient to note and study changes in soil quality properties. Throughout its existence, the institution conducted 10 tours to carry out agrochemical land surveys, 7-10 of which-agrochemical certification.
The agrochemical passport of the field, the land parcel includes more than 20 properties of soil quality depending on the soil-climatic zone and provides ecological-agrochemical assessment of the soil measured in points.
There is a Regional Programme for Soil Protection of Soil of Volyn region that identifies actions for the systematic preservation and recreation of the land in this region.
Methods
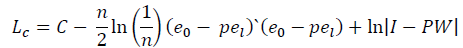
The main purpose of linear regression is to find linear relationships between dependable variables and a set of factor variables (explanatory variables or predictors):
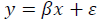
where  variable, -explanatory variables, -regression coefficient, -residual (difference between an observed value and a fitted value y).
The Least Squares Method (LSM) is the best method to approximate the parameters of the regression model by minimizing the sum of squared residuals of actual and predicted values. The regression model is adequate and applicable in practice if:
• The average random error is equal to zero, which means absence of systematic error or shift.
• The random error is distributed according to the normal distribution law.
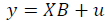
But when a correlation model is built, it is not always possible to meet the said requirements. Especially, if investigated objects are widely distributed on the vast territory (farming companies, land parcels or fields, forests, etc.), the problem then is that the explanatory value of one spatial object depends on the explanatory value of the other spatial object geographically separated from the first one. Spatial data may demonstrate spatial dependence that may be represented as such members of the regression equation as variable ( ), or error (
 ).
).
There are two main reasons why spatial dependence occurs:
• The collection of information within certain spatial massifs may reflect observation error and inaccurately reflect the character of the natural processes-basis of the phenomenon under study.
• Spatial measurement may be a factorial feature in the model.
There are two primary methods for defining spatial dependence.
Mixed spatial autoregressive model
The spatial autoregressive model is an extension of a spatial autoregressive first-order model that includes an additional vector of explanatory values analogous to traditional models of regression analysis. As such variables appear: supplier, crop variety, crop hybrid, natural fertility of soil, average annual rainfall and temperature, etc.
The SAR-model is as follows:
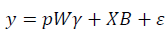
Where, -vector of the reliable value;
  -matrix of factor variables;
  -standard spatial weight dimension matrix;
 parameter, reflecting the strength of spatial dependence;
 -dimensional vector, which demonstrates the level of influence of factor variables on the variation of dependable variable; -vector of noise normally distributed.
Anselin in his study suggested the following algorithm to estimate parameters of the SAR model (Anselin, 2001):
1. Find the least-squares estimate of the parameter for the model
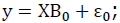
2. Find the least-squares estimate of the parameter for the model
3. Estimate error 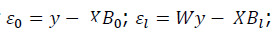
4. Based on estimated errors through the maximizing likelyhood function
Spatial Error Model (SEM)
In spatial error models, spatial dependence is assumed to occur in regression errors.
The SEM-model is as follows:
Where, -vector of dependable variable; -matrix of factor variables; -standard spatial weight dimension matrix; parameter, reflecting spatial correlation of error; -dimensional vector, which demonstrates the level of influence of factor variables on the variation of dependable variable; -vector of noise normally distributed.
Construction of a spatial weight matrix
All methods described above are based on spatial autoregression and require calculation of dependence of each observation on all others. When n observations are available, we obtain n2 of possible connections.
The spatial weights matrix is a matrix with a given quantitative measure (metric), built on the basis of the rule:
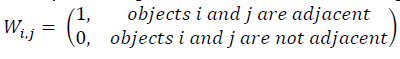
It should be noted that matrix Wi,j is symmetric and has zero main diagonal and is normalized by sum of its rows 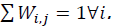
Methods of Research
Sequential scheme of soil sampling to determine agrochemical properties in compliance with DSTU ISO 10381-2:2004 Soil quality. Sampling. Part 2: Guide to sampling techniques. Laboratory tests were conducted in accordance with DSTU in force.
Results
The object of this research were Volyn region soils, regularly examined by the Volyn Agro-chemical Laboratory since 1965-1966, later by Volyn Branch of the State Institution ‘Soil Protection Institute” (Volyn Branch ‘Oblderzhrodiuchist’). This institution, as part of its years-long studies, has analysed main agrochemical properties of various types of soil in the said region.
Taking into account a great amount of work agrochemical survey implies several tours were organized: І-1965-1969; ІІ-1970-1974; ІІІ-1975-1979; ІV-1980-1984; V-1985-1989; VI-1990-1994; VII -1995-1999, VII -2000-2004, ІХ - 2005-2009, Х - 2010-2014.
Volyn Branch annually conducts agrochemical surveys and classifies farm lands that belong to agricultural companies of various forms of incorporation and village councils on approximately 100 hectares of land where 12-13 hectares of soil samples are collected and up to 60 hectares of analysis are made to determine soil fertility and level of contamination by heavy metals, radionuclides, and residues of pesticides. Based on these analyzes the results of soil agrochemical surveys are generalized according to types of farm land, agrochemical cartograms and passports for each field (parcel of land) are developed, and specific scientifically grounded recommendations on efficient and ecologically safe application of agrochemical measures are given (Matviichuk et al., 2020).
Changes in the quality condition of farm soils are complexly analysed and assessed on the basis of agrochemical certification. Agricultural producers order programs on preservation and recreation for certain farms.
The main purpose of these surveys is to create space-and-time system to monitor agroecological condition of soil to detect tendencies in changes in its agrochemical and ecological characteristics under the influence of business activities, unfavourable weather conditions and technogenic-ecological disasters.
The Volyn region is situated in the extreme north-west of Ukraine at the intersection of important transport roads from Eastern to Western Europe, which is extremely important to develop communication with different countries of the world.
The area of the region is 20.1 thousand km2 or 3.3% of Ukraine. It extends for 187 km from the north to the south and 163 km from the west to the east. The distance to Kyiv, the capital of Ukraine, is 398 km. The density of population is 51.6 people per 1 km2.
In the north the region borders with Brest region in Belarus (border extends for 205 km), in the east and south-east-with Rivne region (410 km), in the south-Lviv region (125 km), in the west-Liublin Województwo in Poland (190 km).
The Volyn region is characterized by a moderately warm moderately continental climate with a sufficient amount of moistness and warmth. Its territory occupies the western part of the eastern European Plain and is located in the west of plain spaces of two natural-geographical zones of Ukraine-the Polissia and Forest-steppe. Its larger part (almost three-quarters of the whole area) is located in the bottom western Polissia, and the smaller part in the forest-steppe zone in Volyn forest uplands. Through the territory of the region, the Main European Divide passes that divides river basins of the Black Sea and the Baltic Sea (Pysarenko et al.,2020). The soil of the region was formed on gently undulating plains with absolute altitudes ranging from 150 to 220 m. In general, the relief is characterized by the slight incline to the north-east. The depth of ground and layer waters is shall; they often form single aquifer system that has a great impact on formation of gley, grassland and bog soils, especially on low lands (Matviichuk et al., 2020).
Grain crops in Ukraine occupy 45-50% of the total cultivated area. These crops are the most popular among agricultural crops in
world crop farming. For this reason, we have chosen them for our research.
The first part of our research is devoted to finding the least-squares estimate of the parameter B_0 for the model y=XB_0+ε_0 summative for a certain region (Volyn region) and in the context of spatial segmentation (district level) (Fig. 1).

Fig. 1. Summative for a certain region and in the context of spatial segmentation.
As a result of the correlation analysis we have found strong positive connections between yield and amount of 25, 2 applied and level of acidity and humus content Gm (Table 1).
| Parameters | P2O5 | K2O | pH | Gm | N | Yzer |
|---|---|---|---|---|---|---|
| P2O5 | 1 | |||||
| K2O | 0.84129814 | 1 | ||||
| pH | 0.56082797 | 0.43906664 | 1 | |||
| Gm | 0.32024358 | 0.44777007 | 0.27501457 | 1 | ||
| N | -0.46142516 | -0.51028741 | -0.54669968 | -0.1070783 | 1 | |
| Yzer | 0.63271206 | 0.71818429 | 0.53657613 | 0.56442875 | 0.12139107 | 1 |
Table 1. Results of the correlation analysis.
Let us provide two variants of the mixed spatial autoregressive model:
а) taking account of all factors (Fig. 2):
Yzer=-42,21-0,002*Р2О5+0,28* К2О+3,35*рН+8,91*Gm

Fig. 2. Results of the regression analysis of impact of factors that demonstrate a strong correlation connection with the yield of grain crops yield (SAR-model).
b) factors that demonstrate strong correlation connection (Fig. 3):
Yzer = -40,31 - 0.002 * 25+0.28 * 2+3.35 * р+8.91 * Gm.

Fig. 3. Results of the regression analysis of influence of factors that demonstrate a strong correlation connection with the yield of grain crops yield (SAR-model).
Judging from the results of the spatial autoregressive model, both models are statistically insignificant as the statistical test p-value is high and demonstrates that the investigated hypothesis cannot adequately explain the observation.
Considering previous statistically insignificant results of simulation, we have developed model taking into account spatial error SEM (Fig. 4).

Fig. 4. Results of the regression analysis of impact of all factors on grain crop yield (SEM model).
The simulation results demonstrated the statistical significance of the obtained model obtained (R2>0,65, p-value>0,001). The integrated model (including all districts) demonstrates the following: If 25 is applied above fertilizers application rate by 1 kg and other factors are unchanged, the grain crops yield decreases by 0,004 dt/ha, if 2 is applied above fertilizers application rate by 1 kg, the grain crops yield increases by 0.22 dt/ha when all other factors remain unchanged, if the soil pH increases by 1 unit grain crop yield decreases by 4.16 dt/ha when other factors remain unchanged, if the Gm level of Gm rises by 1 unit grain crop yield increases by 9.21 dt/ha when other factors remain unchanged.
See the analysis of the spatial correlation of dependence of grain crops yield on the main soil for each region (Table 2).
| District | Yzer | P2O5 | K2O | pH | Gm | t-Statistics | P-value |
|---|---|---|---|---|---|---|---|
| Volodymyr-Volynskyi | -58.65 | 0.10 | 0.17 | -1.78 | 38.93 | 18.17642 | 0.0037352 |
| Gorokhiv | -145.14 | -0.20 | 0.59 | -18.90 | 9.90 | 7.002518 | 0.0056586 |
| Ivanychi | -93.12 | 0.10 | -0.05 | -15.66 | 9.33 | 11.58739 | 0.0099356 |
| Kamin-Kashyrskyi | 74.10 | 0.01 | 0.35 | -10.01 | 24.30 | 5.951374 | 0.0019593 |
| Kivertsi | 137.29 | 0.16 | 0.49 | -23.24 | 18.50 | 8.740788 | 0.0037798 |
| Kovel | -117.49 | 0.03 | -0.06 | -1.68 | 96.10 | 28.3447 | 0.0023596 |
| Lokachi | -133.93 | 0.34 | -0.50 | -28.29 | 5.77 | 3.022398 | 0.0041905 |
| Lutsk | -428.33 | -0.16 | -0.05 | -66.88 | 27.41 | 13.89687 | 0.0040560 |
| Liubeshiv | 11.17 | -0.06 | 0.46 | -5.85 | 2.09 | 0.967095 | 0.0037018 |
| Liuboml | 28.39 | -0.02 | 0.29 | -12.68 | 28.81 | 9.028334 | 0.0025070 |
| Manevychi | 102.74 | 0.04 | 0.85 | -31.29 | 14.10 | 16.36816 | 0.0092869 |
| Ratniv | -6.74 | 0.04 | 0.22 | -1.78 | 6.49 | 5.691811 | 0.0070161 |
| Rozhyshche | 91.89 | 0.18 | -0.09 | -12.80 | 0.94 | 0.66881 | 0.0056920 |
| Stara Vyzhivka | 68.83 | 0.24 | -0.15 | -12.40 | 5.42 | 5.095816 | 0.0075215 |
| Turiisk | -3.85 | -0.15 | 0.50 | -2.99 | 14.58 | 2.077286 | 0.0011398 |
| Shatsk | 147.25 | 0.11 | 0.23 | -31.78 | 7.86 | 8.101499 | 0.0082458 |
Table 2. Results of spatial correlation at the district level in Volyn region.
Conclusion
As a result we made a list of districts, where, according to the model we have designed, it is not recommended to exceed fertilizer application rate: 1) Р2О5 Gorokhiv, Lutsk, Liubeshiv and Liuboml districts; 2) К2О Ivanychi, Kovel, Lokachi, Lutsk, Rozhyshche, Stara Vyzhivka districts. The negative impact of the increase in soil р was noted especially in Lokachi, Lutsk, Manevychi, and Shatsk districts. The logical conclusion is that level of humus Gm content in the soil has positive effect. The strategic pathway for further research is to find optimal threshold to exceed mineral fertilizer application rates and on the basis of obtained results come up with new fertilizer application rates for certain districts in the region.
References
Anselin, L. (1988). Spatial econometrics: Methods and modelskluwer academic. Boston, MA.
Anselin, L. (2001). Spatial econometrics. A companion to Theoretical Econometrics, 310330.
Aragon, Y., Haughton, D., Haughton, J., Leconte, E., Malin, E., Ruiz-Gazen, A., Thomas-Agnan, C. (2003). Explaining the Pattern of Regional Unemployment: The Case of the Midi-Pyrénées Region. Papers in Regional Science, 82:155-174.
Armstrong, H., Taylor, J. (1989). Regional Policy and the North-South Divide. In: Shields J. (eds) Making the Economy Work. Palgrave Macmillan, London.
Baltagi, B.H., Li, D. (2004). Prediction in the panel data model with spatial correlation. In Advances in Spatial Econometrics, pp:283-295).
Baltagi, B.H., Li, D. (2006). Prediction in the panel data model with spatial correlation: the case of liquor. Spatial Economic Analysis, 1:175-185.
Baltagi, B.H., Fingleton, B., Pirotte, A. (2014) Estimating and forecasting with a dynamic spatial panel model. Oxford Bulletin of Economics and Statistics, 76:112-138.
Elhorst, J.P. (2003). The mystery of regional unemployment differentials: Theoretical and empirical explanations. Journal of Economic Surveys, 17:709-748.
Girardin, E., Kholodilin, K.A. (2011). How helpful are spatial effects in forecasting the growth of Chinese provinces?. Journal of Forecasting, 30:622-643.
Goldberger, A.S. (1962). Best linear unbiased prediction in the generalized linear regression model. Journal of the American Statistical Association, 57:369-375.
Greenwood, M.J., Hunt, G.L., Rickman, D.S., Treyz, G.I. (1991). Migration, regional equilibrium, and the estimation of compensating differentials. The American Economic Review, 81:1382-1390.
Matviichuk, B.V., Matviichuk, N.H. (2020). Spatial-temporal dynamics of water erosion within Volyn region. Taurian Scientific Bulletin 116:183-192.
Matviichuk, B.V., Matviichuk, N.H. (2020). Factors of soil sensitivity to erosion in Volyn region. Bulletin of Poltava State Agrarian Academy, 3:79-90.
Nijkamp, P., Paelinck, J. (1973). Some models for the economic evaluation of the environment. Regional and Urban Economics, 3:33-62.
Pysarenko, P.V., Matviichuk, B.V., Matviichuk, N.H. (2020). Deflation risks of soil cover in Volyn region. Bulletin of Poltava State Agrarian Academy, 4:112-119.
Author Info
B.V. Matviichuk1*, N.H. Matviichuk1, S.I. Matkovska1 and M.M. Prystavskyi22Poltava State Agrarian Academy, 1/3 Skovorodi str., Poltava, 36000, Ukraine
Citation: Matviichuk, B.V., Matviichuk, N.H., Matkovska, S.I., Prystavskyi, M.M. (2021). Spatial analysis of the impact of main agrochemical characteristics of the soil on grain crops yield in the Volyn region. Ukrainian Journal of Ecology. 11 (7), 110-115.
Received: 04-Aug-2021 Accepted: 18-Sep-2021 Published: 27-Sep-2021
Copyright: This is an open access article distributed under the terms of the Creative Commons Attribution License, which permits unrestricted use, distribution, and reproduction in any medium, provided the original work is properly cited.