
Research Article - (2025) Volume 15, Issue 6
The Spatio-temporal dynamics and predictive modeling of land use change relation with biodiversity conservation at Aboudjokopé community forest scale in Togo
Amenyekpo Afi Ida1,2,3*, Kombate Bimare1, Folega Fousséni1, Souandja Sinandja1,2, Wala Kperkouma1 and Batawila Komlan4Abstract
A study of vegetation dynamics in the Aboudjokopé Community Forest (ACF) between 2000 and 2023 revealed significant changes in land-use units, linked to anthropogenic activities and conservation efforts. This study is a contribution to the sustainable management of natural habitats in Togo. Landsat - Greenest Pixel Yearly (Greenest-Pixel) images were used to analyze the evolution of the main vegetation formations, including savannahs, agroforestry parks, fallows and crops, forests, human settlements and wetlands. Simulation of land-use units to 2049 were carried out using the ʺCellular Automata Simulationʺ model of the MOLUSCE extension of QGIS 2.18 software. The dynamics of land-use units reveal that in 2000, savannahs covered 87.43% (640 ha). However, they have undergone a regressive dynamic to reach 58.79% (431 ha) in 2023. This decline in savannah has mainly benefited agroforestry parks, fallow land and crops, which grew significantly until 2009, reaching 54.49% (400 ha). Forest ecosystems, on the other hand, represented 6.56% (48 ha) in 2000, with a gradual increase to 39.84% (292 ha) in 2023, suggesting a gradual rehabilitation of forest areas. Simulated projections for 2049 predict a continued reduction in savannahs and human settlements in favor of forest formations. This study can initially be used as a source of information for planning community governance tools. However, further analysis of the contribution of potential sources to local climate mitigation is required.Keywords
Sustainable, Land-use, Degradation, Conservation, Predictive modelling, Climate mitigation.
Introduction
Terrestrial ecosystems host exceptional biodiversity that provides numerous goods and services to humanity. Despite this importance, these ecosystems are undergoing accelerated transformations under the combined effect of climate change and anthropogenic pressures (Folega F. et al., 2022; N'konou R. 2024). The speed and scale of degradation and deforestation of forest lands in West Africa reach unparalleled levels on a planetary scale, signaling an ecological emergency (Folega F. et al., 2017; Atsri HK. et al., 2018). These countries hold the world record for the degradation of forest potential (Atakpama W. et al., 2017). This dynamic, constantly evolving, highlights the complexity of monitoring these landscapes (Madelaine-Antin C. 2009; Kombate B. et al., 2019).
In Togo, anthropogenic activities, combined with the effects of global changes, alter most landscapes, leading to drastic habitat fragmentation and a decline in biodiversity (Polo-Akpisso A. et al., 2016; Kombate B. et al., 2020). In response to this situation, forest preservation and the fight against climate change have become an urgent national concern, hence the ambition to restore more than 1.4 million hectares of forests by 2030, under the AFR100 initiative (NEPAD, 2022). Many other national measures, such as the National Environmental Action Plan (PNAE) (1998), the National Strategy for the Conservation of Biological Diversity (CDB) (2003), the revision of the National Forest Action Plan (2011), the National Development Plan (PND) (2018) and the government roadmap (2025), have been developed to protect and preserve forest ecosystems.
Despite these efforts, degradation and deforestation of natural habitats are observed in parts of Togo (Folega F. et al., 2020), notably in the Agou Prefecture and more specifically in Aboudjokopé (Egbelou et al., 2021). Although essential for local biodiversity and ecosystem services, community forests are not spared from degradation, deforestation and landscape fragmentation that threaten their ecological functionality (Atakpama W. et al., 2017; Atakpama W. et al., 2022; Kombate B. et al., 2023; Crépin, LT. et al., 2025). Faced with these challenges, the Aboudjokopé Community Forest (ACF) perfectly illustrates these dynamics and challenges. It is subject to both natural influences and direct human actions, some undertaken by the NGO "Nature Office" led by Ecocent-Togo, which aims to restore and protect this fragile environment. This forest is undergoing significant landscape changes reflecting processes of natural regeneration, reforestation and land use change (Egbelou H. et al., 2021). These observations raise several questions. How has the spatial dynamics of the ecosystems in the Aboudjokopé community forest evolved before and after the intervention of the NGO "Nature Office"? What will be the evolution of habitats until the end of the project in 2049?
This study is part of a proactive conservation and sustainable management approach aiming to combine biodiversity protection and local socio-economic development. To better understand these dynamics and anticipate their consequences, it is essential to use remote sensing and modeling tools. The overall objective is to contribute to the sustainable management of natural habitats in Togo. Specifically, it aims to: (i) analyze the spatial dynamics of the 2000-2023 time series and; (ii) model the dynamics of land cover units by 2049.
Materials and Methods
Geographical location of the Aboudjokopé Community Forest (ACF)
Located between 6°38'23" and 6°40'45" North latitude and between 0°42'10" and 0°43'57" East longitude, the ACF is one of the large forests in the Agou Prefecture in the Plateaux Region of Togo. With an area of approximately 726 ha, this forest is currently managed by the NGO "Ecocent-Togo" under the governance of the Germany-based NGO "Nature Office". It is located in ecological zone IV, in the Agotimé North canton, bounded to the North and West by the village of Aboudjokopé, to the South by Glikpo and to the East by the village of Kplokploti (Fig. 1.).

Fig. 1. Location of the study area
The ecosystem is influenced by several factors. Aboudjokopé enjoys a sub-equatorial Guinean-type climate with four seasons (two rainy seasons, from April to July and September-October and two dry seasons, from November to March and in August), with annual rainfall ranging between 1500 and 2300 mm and average temperatures of 22 to 30°C. The relief is relatively flat, with sandy-loamy soils rich in humus (Lamouroux M. 1969). The hydrographic network is dominated by the "Egbi" river, 61 kilometers long, located east of the community forest, which supports biodiversity, especially in the dry season, complemented by ponds and temporary watercourses.
The vegetation includes dry and semi-deciduous dense forests, characteristic of ecological zone IV (Ern H. 1979). The vegetation of Aboudjokopé consists mainly of dense forests, riparian forests, open forests/wooded savannahs, tree savannahs/shrub savannahs and agroforestry parks-fallow-croplands according to the Togo classification. Wildlife includes warthogs, Western kob, deer, monkeys, wild guinea fowls, gazelles, insects, cane rats, squirrels, snakes, birds, tutles.
Socio-economically, approximately 1,553 inhabitants live near the forest (Ewés, Adjas, Kabyès and Mobas), practicing animism or Christianity. Their income comes mainly from agriculture (maize, millet, sorghum, soy, peanut, yam, cassava...), livestock (sheep, goats, horses, rabbits), hunting, trade and crafts.
Data collection
Acquisition of satellite imagery: A significant source of pre-classified medium-resolution satellite data was obtained from the Earthmap.org platform (https://earthmap.org/) using the vector file of the ACF. This was a series of Landsat - Greenest Pixel Yearly images with a spatial resolution of 30 meters, covering the years 2000 to 2023. This data source, referred to as Landsat - Greenest Pixel Yearly (Greenest-Pixel), was produced by Google Earth Engine processes that considered all annual scenes, from the first day of the year to the last, focusing on the greenest pixels as the composite value.
The specific choice of Landsat - Greenest Pixel Yearly images was justified by their consideration of all annual scenes, from the first to the last day of the year, their availability and their free access. These images, in addition to their quality, offered a reliable and easily accessible resource for analysis over an extended period.
Other data from the 30m resolution Digital Elevation Model (DEM), such as slope, biophysical data (road network, rivers) and environmental data (slope, elevation), were used to assess the influence of biophysical factors on land cover (Kombate B. et al. 2023).
Data processing
Classification and post-classification of satellite images: To improve the pre-classification of land cover units, a classification and post-classification were performed using the pre-classified Landsat - Greenest Pixel Yearly images from 2000 to 2023 available on the Earthmap.org platform (https://earthmap.org/). The classification involved aggregating similar pixels representing different land cover types based on codes ranging from 1 to 5 (Table 1) using ArcMap 10.4.1 software (Khoudiri F. et al. 2024). To reclassify the land cover units according to ground realities, Google Earth images were visualized (Egbelou H. et al., 2021). Land use and land cover classes were determined by referring to the Togo classification from the National Forest Inventory, as well as the categorization colors of the Normalized Difference Vegetation Index (NDVI). These classes include wetlands, human settlements (built-up areas and bare soil), agroforestry parks, fallow and croplands, savannahs (wooded, shrub and tree) and forests (open and dense).
| Land use units | Codes |
|---|---|
| Wetlands | 1 |
| Human settlements | 2 |
| Agroforestry parks, Fallow lands and crops | 3 |
| Savannahs | 4 |
| Forests | 5 |
Table 1. Land use unit codes.
Post-classification was performed by vectorizing the rasters from the classification. Then, the vectors were imported into QGIS 3.16 software for pixel recoding for subsequent layout.
Spatio-temporal dynamics of land cover
Before proceeding with a final layout of the cartographic results, the area of the different classes for each year was generated in ArcMap 10.4.1 software. After obtaining the areas, the different images underwent a spatial analysis of the land cover units to establish the spatio-temporal dynamics of land cover.
The rate of change (Ta) of a given land cover unit between two years X and Y, expressing the proportion of each natural vegetation unit that changes annually, was evaluated (Folega et al., 2021) by the following relation :
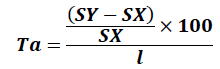
Where: SX = area of a vegetation unit in year X: SY = area of the same vegetation unit in year Y; I = number of years between years X and Y.
If Ta = 0, it is concluded that there is stability. If Ta<0, it is concluded that this unit has decreased. If Ta>0, it is concluded that this unit has expanded.
Predictive modeling of land cover by 2049: In this study, InVEST 3.14 software and the MOLUSCE plugin for QGIS 2.18 were used to analyse land cover changes and project these evolutions until 2049, with particular attention paid to the years 2014 and 2018. These two years were specifically selected as they highlight the efforts of the NGO Ecocent-Togo, which initiated significant actions for ecosystem conservation and improvement of the local environment. The changes observed during this period thus reflect the tangible impacts of this NGO's interventions.
First, InVEST 3.14 software was used to extract and align rasters of biophysical factors such as the road network, rivers and environmental factors including slope and elevation maps. These data were carefully selected and prepared to ensure they were aligned in terms of spatial projection and resolution, thus ensuring reliable analysis. InVEST allowed processing these different geospatial layers, making them ready for the modeling stage.
Next, the MOLUSCE plugin was used for modeling land cover changes using Artificial Neural Networks (ANN). The land cover maps for 2014 and 2018 were loaded into the MOLUSCE input module, providing a basis for analyzing transitions between different land cover units (Rahnama MR. 2021; Muhammad R. et al. 2022; Baghel S. et al. 2024). MOLUSCE calculated the changes between these two years, generating transition matrices that show the dynamics between different land cover types. These matrices allowed visualizing the direct impacts of Ecocent-Togo's actions, such as reforestation efforts.
The results of this analysis were then used to train an Artificial Neural Network (ANN) model, taking into account biophysical (road network, rivers) and environmental (slope, elevation) data as explanatory variables. The ANN model was used to model future land cover changes based on historical trends between the classified images of 2014 and 2018.
To validate the model, a simulation of land cover for the year 2023 was performed. The Kappa coefficient was used to measure the agreement between the simulated maps for 2023 and the classified image. A high Kappa coefficient demonstrated the model's accuracy. Once validated, the model was used to project land cover changes to the 2049 horizon. This projection allows anticipating the evolution of land cover under the influence of Ecocent-Togo's actions and environmental factors, thus providing a clear vision of long-term impacts.
Results
Dynamics of land cover units from 2000 to 2023 in the ACF
The analysis of land cover dynamics in the protected forest of Aboudjokopé between 2000 and 2023 reveals significant fluctuations (Fig. 2 and 3) as follows: between 2000 and 2002, human settlements experienced a slight increase from 1.23% to 2.59%, then decreased in 2003 to 1.09%. Meanwhile, wetlands underwent a constant decline, from 6.56% in 2000 to 0.27% in 2003. Forests also decreased significantly in 2003 after a slight increase in 2001 and 2002, while savannahs showed a downward trend until 2002, followed by a slight increase in 2003.

Fig. 2. Evolution of ACF land use units from 2000 to 2023.

Fig. 3. Spatial analysis of land use units in the ACF from 2000 to 2023.
Agroforestry parks, fallow and croplands showed strong growth, from 2 hectares in 2000 to 395 hectares in 2007. Savannahs decreased significantly between 2004 and 2007, a regression of 31.48%, while forests experienced slight fluctuations but remained overall stable.
During the period from 2008 to 2011, agroforestry parks, fallow and croplands maintained their area, while savannahs showed a downward trend. Human settlements remained relatively stable, as did forests, which increased in 2011 after a slight decrease in 2008.
Savannahs showed a slight increase in 2013, followed by a decrease in 2014 and 2015. Forests, on the other hand, showed an opposite trend, with a slight decrease in 2013 followed by an increase in 2014 and 2015. Agroforestry parks, fallow and croplands showed a constant decrease over the period from 2012 to 2015.
Savannahs decreased significantly in 2019, while forests showed a considerable increase. Human settlements remained relatively stable throughout the period 2016 - 2019, as did wetlands, which maintained a constant area with very small fluctuations.
In 2021, savannahs experienced a slight decrease, followed by an increase in 2022 before decreasing again in 2023. Forests, on the other hand, showed an opposite trend, with a slight increase in 2021, then a decrease in 2022 before a new increase in 2023. Human settlements and wetlands remained relatively stable throughout the period 2020 to 2023.
Predictive dynamics of land cover units by 2049: The assessment of classification accuracy results from pixel confusion matrices gives 88.26% with a Kappa coefficient of 0.75. The predictive modeling of land cover units in the ACF by 2049 shows several trends (Fig. 4.).

Fig. 4. Simulation of land use by 2049.
Between the classified image of 2023 and the 2023 simulation (Fig. 4.), wetlands experienced a significant increase of 0.06% in terms of area, from 0.08% to 0.14%, an increase of 0.42 ha. This expansion suggests growth of wetlands in the simulation compared to reality. Human settlements also show an increase of 0.05% in terms of area, from 1.27% to 1.32%, an increase of about 0.33 ha. This rise indicates a slightly increased growth of bare soil and built-up areas in the simulation compared to the actual situation. However, for agroforestry parks, fallow and croplands, although variations are minimal, a slight decrease of 0.01% in terms of area is observed, from 0.02% to 0.01%, representing a regression of 0.09 ha. In contrast, savannahs show an increase of 0.47% in terms of area, from 57.81% to 58.28%, an increase of about 3.40 ha, suggesting a slight expansion in the simulation compared to reality. Forests show a decrease of 0.56% in terms of area, from 40.82% to 40.26%, corresponding to a regression of about 4.07 ha, indicating a slight decrease in forest cover in the simulation compared to reality (Fig. 4.).
A2023 : ACF in 2023, A2023SI : Simulated ACF in 2023, A2049SI: Simulated ACF in 2049.
Between the 2023 simulation and the 2049 simulation, changes are overall minimal (Fig. 4.). Wetlands, human settlements and agroforestry parks, fallow and croplands show relatively stable percentages between the two periods. However, savannahs show a decrease of 0.19%, from 58.28% to 58.09%, a regression of about 1.39 ha, indicating a slight decrease in the 2049 simulation compared to the 2023 simulation. Conversely, forests show an increase of 0.2% in terms of area, from 40.26% to 40.46%, equivalent to an increase of about 1.42 ha, suggesting a slight expansion of forest cover in the 2049 simulation compared to the 2023 simulation (Fig. 5., Table 2).

Fig. 5. Predictive evolution of land use.
| 2023 classified to 2023 Simulation | 2023 simulation to 2049 simulation | 2023 to 2049 simulation | ||||
|---|---|---|---|---|---|---|
| Land use units | Area (%) | Area (ha) | Area (%) | Area (ha) | Area (%) | Area (ha) |
| Wetlands | 0.06 | 0.42 | 0.00 | 0.00 | 0.06 | 0.42 |
| Human settlements |
0.05 | 0.33 | 0.00 | -0.04 | 0.04 | 0.30 |
| Agroforestry Parks, Fallow lands and crops | -0.01 | -0.09 | 0.00 | 0.00 | -0.01 | -0.09 |
| Savannahs | 0.47 | 3.40 | -0.19 | -1.39 | 0.28 | 2.01 |
| Forests | -0.56 | -4.07 | 0.20 | 1.42 | -0.36 | -2.65 |
Table 2. Rate of change in land use units from 2023 to 2049.
Between the classified image of 2023 and the 2049 simulation, several significant evolutions are observed in the different land cover unit categories (Fig. 5.). Wetlands experienced a remarkable increase of 0.06%, from 0.08% to 0.14%, an increase of 0.42 ha. This expansion suggests an increase in wetlands in the 2049 simulation compared to 2023. Meanwhile, human settlements experienced a slight increase of 0.04%, from 1.27% to 1.31%, representing an increase of about 0.30 ha.
Although this increase is modest, it indicates continued growth of human settlements between the two periods. In contrast, agroforestry parks, fallow and croplands show a significant decrease of 0.01%, from 0.02% to 0.01%, a regression of 0.09 ha. This decrease shows a conversion of agricultural land to other uses or a reduction in agricultural activity between 2023 and the 2049 simulation. Furthermore, savannahs show an increase of 0.28%, from 57.81% to 58.09%, corresponding to an increase of about 2.01 ha. This increase suggests a slight expansion of savannahs in 2049 (Fig. 4 and 5, Table 2). However, forests show a slight decrease of 0.36% of their area, from 40.82% to 40.46%, a regression of about 2.65 ha. This decrease is attributed to a possible conversion of forest areas to other land use types between the two periods (Fig. 4 and 5, Table 2).
Discussion
Land cover dynamics of the ACF
The spatio-temporal analysis of land cover units in the ACF reveals complex dynamics, reflecting the combined impact of anthropogenic pressures, local conservation initiatives and natural ecological processes. The initial regression of 31.5% of savannahs between 2004-2007 and of forests in favor of agroforestry parks reflects the direct impact of increasing agricultural pressure and unsustainable practices. This trend is consistent with observations made in other Togolese community forests (Atakpama W. et al. 2017; Atakpama W. et al. 2022; Kombate B. et al. 2023; Crépin LT. et al. 2025), where slash-and-burn agriculture and unregulated wood exploitation have led to habitat fragmentation and biodiversity loss (Adjonou K. et al. 2010; Dimobe KANGBENI et al. 2017; Kombate B. et al. 2020; Kaina et al. 2023). Over the period 2000-2023, the significant regression from 87.43% to 58.79% of savannahs in favor of a substantial increase from 6.56% to 39.84% of forest areas indicates a notable reversal of the initial degradation trends observed in many similar ecosystems in West Africa (Egbelou H. et al. 2021; Crépin LT. et al. 2025). This positive evolution can be largely attributed to the actions of the NGO Ecocent-Togo, which implemented concrete measures such as establishing firebreaks, strictly regulating forest resource extraction and enrichment planting with native species like Khaya senegalensis (Desr.) A.Juss. using various methods (lines and rings). These interventions show their effectiveness in the gradual rehabilitation of forest environments and testify to a model of participatory and locally anchored conservation, consistent with studies on the sustainable management of community forests (Folega F. et al. 2017).
However, this dynamic is not uniform and shows interannual fluctuations, notably for savannahs and forests. For example, between 2013 and 2015, a slight increase in savannahs was followed by forest recovery, suggesting ecological succession processes or climatic variations. These fluctuations highlight the ecosystem's sensitivity to external factors and the need for adaptive management. Furthermore, the continuous decrease of wetlands (from 6.56% in 2000 to 0.08% in 2023) remains concerning, as these habitats are critical for aquatic biodiversity and hydrological regulation. Although conservation actions have slowed their decline, their restoration requires targeted interventions, such as bank protection and reduced water withdrawals.
Predictive changes in land cover by 2049 in the ACF
The predictive modeling of land cover by 2049, performed by artificial neural networks via the MOLUSCE tool, reveals contrasting trends and an uncertain future. The slight predicted decrease in forest areas (-0.36%) and the moderate recovery of savannahs (+0.28%) suggest that current gains could be fragile and dependent on the continuation and intensification of conservation efforts. These trends could indicate natural dynamics of ecological succession or effects of human management, such as conservation and reforestation policies (Kombate B. et al. 2023; Kombate B. et al. 2024). The persistence of the potential forest decline calls for increased vigilance, especially in the face of external factors not explicitly modeled, such as climate change, growing demographic pressure, or new exploitation modes. For example, the model assumes a continuity of past dynamics without anticipating possible disruptions like a sudden intensification of agriculture or a socio-political crisis. Moreover, the 30-meter spatial resolution may underestimate local changes, particularly in transition zones between savannahs and forests. These uncertainties underline the need to couple modeling with participatory scenarios involving local communities to better understand underlying socio-economic factors (Aboudoumisamilou I. et al. 2022). Despite these limitations, the projections offer valuable insights for management. The slight expansion of savannahs between 2023 and 2049 could reflect natural recolonization on abandoned agricultural land, but also forest degradation if anthropogenic pressures persist. The decrease in agroforestry parks (-0.01%) indicates a continued reduction in agricultural land, offering opportunities for ecological restoration.
Conclusion
The in-depth analysis of the evolution of land cover units in the ACF reveals significant trends and important implications for the management and conservation of this precious ecosystem. This study reveals a notable expansion of savannahs, a decrease in human settlements and wetlands and a relative increase in forests. These changes result from various factors, including anthropogenic activities, conservation policies and natural resource management practices. These changes in land cover have important implications for biodiversity, connectivity between different vegetation formations and the ecological balance of this forest.
By projecting the future evolution of the ACF to the 2049 horizon, it is clear that additional conservation measures will be needed to preserve its biodiversity and maintain its ecological connectivity. The decrease in agroforestry parks, fallow and croplands offers opportunities for the regeneration of natural vegetation, but this will require balanced management and effective policies to ensure the long-term sustainability of this ecosystem. Thus, the sustainable management of this forest requires a multisectoral and collaborative approach, involving government authorities, local communities, non-governmental organizations and the private sector. By working together to preserve biodiversity, promote sustainable development and strengthen governance, it is possible to ensure the conservation of this precious ecosystem for future generations. Regular monitoring of the evolution of land cover units is essential to assess the effectiveness of the implemented management measures.
Acknowledgement
This study received financial and technical support from the NGO "Ecocent-Togo" and equipment from the SPIRIT project [Grant number IZSTZ0_193032] of the SNF (Swiss National Science Foundation). Sincere thanks to the reviewers for their input and suggestions.
Conflict of Interest
The authors declare no conflicts of interest.
References
Folega, F., Datche-Danha, K. E., Folega, A. A., Woegan, A. Y., Wala, K., Akpagana, K. (2022). Diversity of ecosystem services and land use in the Eburnean basement landscape of Togo. Nature and Technology Review 14: 61-75.
N'konou, R. (2024). Types of terrestrial ecosystems and examples. 13.
Folega, F., Atakpama, W., Pereki, H., Djiwa, O., Dourma, M., Abreni, K., Akpagana, K. (2017). Ecological and socio-economic potential of the Agbedougbe community forest (Plateaux-Togo region). Journal of Scientific Research of the University of Lome 19: 31-50.
Atsri, H. K., Abotsi, K. E., Kokou, K. (2018). Ecological issues in the conservation of semi-montane forest-savanna mosaics in central Togo (West Africa). Journal of Animal & Plant Sciences 38 6112-6128.
Google Scholar, Cross Ref, Indexed at
Atakpama, W., Folega, F., Azo, A. K., Pereki, H., Mensah, K., Wala, K., Akpagana, K. (2017). Mapping, diversity and demographic structure of the Amavenou community forest in the Agou prefecture of Togo. Rev Geog Univ Ouagadougou 2: 59-82.
Kombate, B., Dourma, M., Folega, F., Woegan, A. Y., Wala, K., Akpagana, K. (2019). Structure and carbon sequestration potential of wooded formations of the Akposso Plateau in the sub-humid zone of Togo. Afrique Science 15: 70-79.
Polo-Akpisso, A., Wala, K., Ouattara, S., Foléga, F., Tano, Y. (2016). Changes in land cover categories within Oti-Kéran-Mandouri (OKM) complex in Togo (West Africa) between 1987 and 2013. Springer International Publishing 3-21.
Google Scholar, Cross Ref, Indexed at
Kombate, B., Dourma, M., Folega, F., Atakpama, W., Wala, K., Akpagana, K. (2020). Spatio-temporal dynamics and habitat fragmentation within a central region of Togo. Agricultural Science Research Journal 10: 291-305.
Folega F., Dourma M., Wala K., Woegan Y., Batawila K., Akpagana K. (2020). Suivi de la vulnérabilité des zones Agroécologiques par télédétection spatiale dans un contexte de changement climatique au Togo. Poster. Universite de Lome 1-2.
Atakpama, W., Egbelou, H., Folega, F., Afo, C., Batawila, K., Akpagana, K. (2022). Floristic diversity of community forests in the Dankpen prefecture of Togo. Moroccan Journal of Agronomic and Veterinary Sciences 10.
Kombate, B., Atakpama, W., Egbelou, H., Ahuide, K., Dourma, M., Folega, F., Akpagana, K. (2023). Land cover dynamics and carbon modeling of the Alibi-I Community Forest. Annals of Forestry Research in Algeria 13: 13-26.
Crépin, LT, Wouyo, A., Bareremna, A., Hodabalo, E., Bimare, K., Abdoumissamilou, I., Komlan, B. (2025). Vegetation dynamics and biological diversity of the Ando-Akpuive community forest (FCAA) in the Avé prefecture of Togo. Environmental dynamics. International Journal of Geosciences and the Environment 1-33.
Lamouroux, M. (1969). Soil map of Togo at 1:1,000,000 (p. 99). Office of Overseas Scientific and Technical Research, ORSTOM Centre in Lome.
Ern, H. (1979). The vegetation of Togo. Structure, endangerment and conservation. Willdenowia 295–312.
Kombate, B., Atakpama, W., Egbelou, H., Yandja, M., Bawa, A., Dourma, M. Akpagana, K. (2023). Structure and carbon modeling of the missahohoe classed forest in Togo. African Journal on Land Policy and Geospatial Sciences 6: 042-061.
Google Scholar, Cross Ref, Indexed at
Khoudiri, F., Chakal, A. N. (2024). Study of the dynamics of vegetation through the use of vegetation indices in the region of Djelfa, Algeria. IEEE Mediterranean and Middle-East Geoscience and Remote Sensing Symposium (M2GARSS) 260-264.
Google Scholar, Cross Ref, Indexed at
Rahnama, M. R. (2021). Forecasting land-use changes in Mashhad Metropolitan area using cellular automata and Markov chain model for 2016-2030. Sustainable Cities and Society 64: 102548.
Google Scholar, Cross Ref, Indexed at
Muhammad, R., Zhang, W., Abbas, Z., Guo, F., Gwiazdzinski, L. (2022). Spatiotemporal change analysis and prediction of future land use and land cover changes using QGIS MOLUSCE plugin and remote sensing big data: A case study of Linyi, China. Land 11:419.
Google Scholar, Cross Ref, Indexed at
Baghel, S., Kothari, M. K., Tripathi, M. P., Singh, P. K., Bhakar, S. R., Dave, V., Jain, S. K. (2024). Spatiotemporal LULC change detection and future prediction for the Mand catchment using MOLUSCE tool. Environmental Earth Sciences 83: 66.
Google Scholar, Cross Ref, Indexed at
Adjonou, K., Djiwa, O., Kombate, Y., Kokutse, AD, Kokou, K. (2010). Study of the spatial dynamics and structure of the relict dry dense forests of Togo: implications for sustainable management of protected areas. International Journal of Biological and Chemical Sciences 4.
Google Scholar, Cross Ref, Indexed at
Dimobe, K. A. N. G. B. E. N. I., Goetze, D. E. T. H. A. R. D. T., Ouedraogo, A., Forkuor, G. E. R. A. L. D., Wala, K., Porembski, S., Thiombiano, A. (2017). Spatio-temporal dynamics in land use and habitat fragmentation within a protected area dedicated to tourism in a Sudanian savanna of West Africa. Journal of Landscape Ecology 10: 75-95.
Google Scholar, Cross Ref, Indexed at
Kombate, B., Attackpama, W., Klevor, K. A., Egbelou, H., Kanda, M., Dourma, M., Akpagana, K. (2024). Vegetation fires are causing degradation and deforestation in the Fazao-Malfakassa National Park (PNFM) in Togo. African Journal on Land Policy and Geospatial Sciences 7: 218-229.
Google Scholar, Cross Ref, Indexed at
Aboudoumisamilou, I. (2022). Participatory mapping of the riparian areas of the Abdoulaye wildlife reserve in Togo. Revue Ecosystemes Et Paysages: University of Lome 2 83-97.
Hodabalo, E., Wouyo, A., Marra, D., Fousséni, F., Koffi, A. (2021). Spatio-temporal dynamics and flora of the Aboudjokope forest in Togo. Synthesis: Journal of Science and Technology 27: 37-50.
Folega, A. A., Folega, F., Woegan, A. Y., Wala, K., Akpagana, K. (2021). Dynamics of greenhouse gas emissions from the forestry sector and other land uses (FAT) in the Eburnean basement landscape in Togo. Rev Ecosystems and Landscapes 1: 58-72.
Google Scholar, Cross Ref, Indexed at
Fousseni, F., Andrianamenoso, R. M., Kperkouma, W., Agbelessessi, W. Y., Madjouma, K., Hodabalo, P., Koffi, A. (2017). Ecology and spatio-temporal dynamics of mangroves in Togo. Vertigo 17.
Google Scholar, Cross Ref, Indexed at
Greenest-Pixel, Landsat 7 Collection 1 Tier 1 Annual Greenest-Pixel TOA Reflectance Composite.
Ehlui, K. S. (2024). Dynamic and floristic structure of kouampante community forest (Savannahs’ Region, Togo).
Google Scholar, Cross Ref, Indexed at
Auda, N. (2022). The State of AFR100: The progress of forest landscape restoration by implementing partne. Audanepad, Midrand, South Africa.
Author Info
Amenyekpo Afi Ida1,2,3*, Kombate Bimare1, Folega Fousséni1, Souandja Sinandja1,2, Wala Kperkouma1 and Batawila Komlan42Department of Forestry, National Institute of Agricultural Training, Tové, Togo
3Doctoral School of Informatics for Climate Change, Joseph KI-ZERBO University, Burkina Faso
4Department of Botany, Faculty of Science, Research Unit in Systematic and Biodiversity Conservation, Lab of Botany and Plant Ecology, University of Lomé, 01 BP 1515, Lomé, Togo
Citation: Ida, AA., Bimare K., Fousséni F., Sinandja S., Kperkouma W., Komlan B. (2025). The Spatio-temporal dynamics and predictive modeling of land use change relation with biodiversity conservation at Aboudjokopé Community Forest scale in Togo. Ukrainian Journal of Ecology. 15:1-11.
Received: 12-Sep-2025, Manuscript No. UJE-25-171003; , Pre QC No. P-171003; Editor assigned: 15-Sep-2025, Pre QC No. P-171003; Reviewed: 01-Oct-2025, QC No. Q-171003; Revised: 15-Oct-2025, Manuscript No. R-171003; Published: 01-Nov-2025, DOI: 10.15421/2025_642
Copyright: This work is licensed under a Creative Commons Attribution 40 License